Agriculture Reference
In-Depth Information
1
2
3
4
5
6
7
8
9
10
11
12
13
14
15
16
17
18
19
20
21
22
23
24
25
26
27
28
29
30
31
32
33
34
35
36
37
38
39
40
41
42
43
44
45
46
weighting function. The difference between AWRI and precipitation that
was averaged for 60 stations from 1974 through 1998 is shown in figure
30.2. It can be seen in figure 30.2 that the AWRI curve shows the concen-
tration of water resources better than the precipitation curve. These indices
and software for computing these indices are currently being verified and
are available on a Web site
(http://atmos.pknu.ac.kr/~mdr).
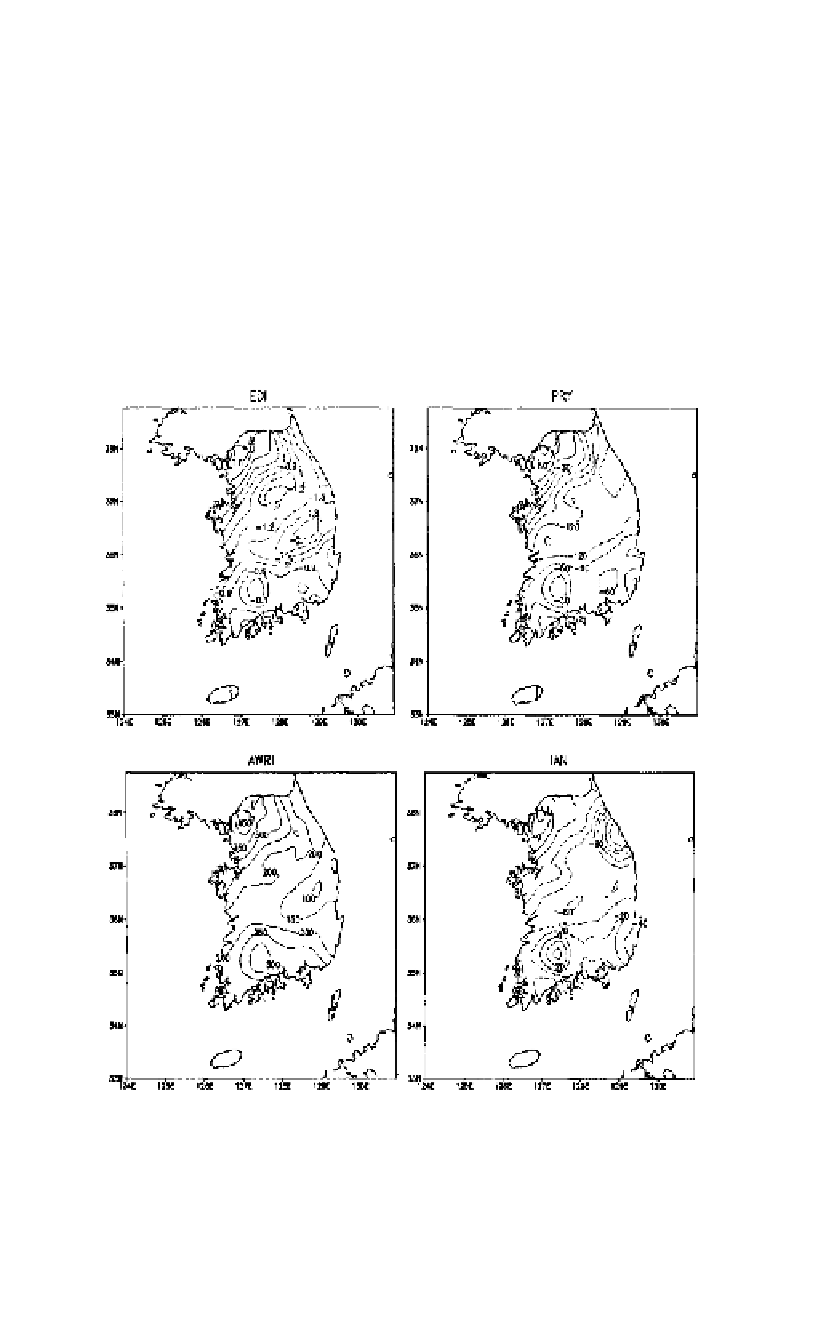
Figure 30.3 shows the spatial distributions of four drought indices for
August 31, 2001, when a severe drought occurred. The EDI is different
from the PDSI, SPI, and other indices (McKee et al., 1993; Hayes et al.,
1999) because it can precisely capture the daily variation in drought inten-
sity. The most important characteristic of the EDI is that the EDI shows
both drought duration and severity. An EDI of less than
0.7, between -
0.8 and -1.5, and between -1.6 and -2.5, means mild, moderate, and severe
−
[391
Line
——
0.0
——
Norm
PgEn
[391
Figure 30.3
Four indices that show the drought severity on August 31, 2001. Detailed
information on these indices are available online (
http://atmos.pknu.ac.kr/ mdr)
and in Byun
an
d Wilhite (1999).


Search WWH ::

Custom Search