Agriculture Reference
In-Depth Information
1
2
3
4
5
6
7
8
9
10
11
12
13
14
15
16
17
18
19
20
21
22
23
24
25
26
27
28
29
30
31
32
33
34
35
36
37
38
39
40
41
42
43
44
45
46
[371
Line
——
-0.0
——
Norm
PgEn
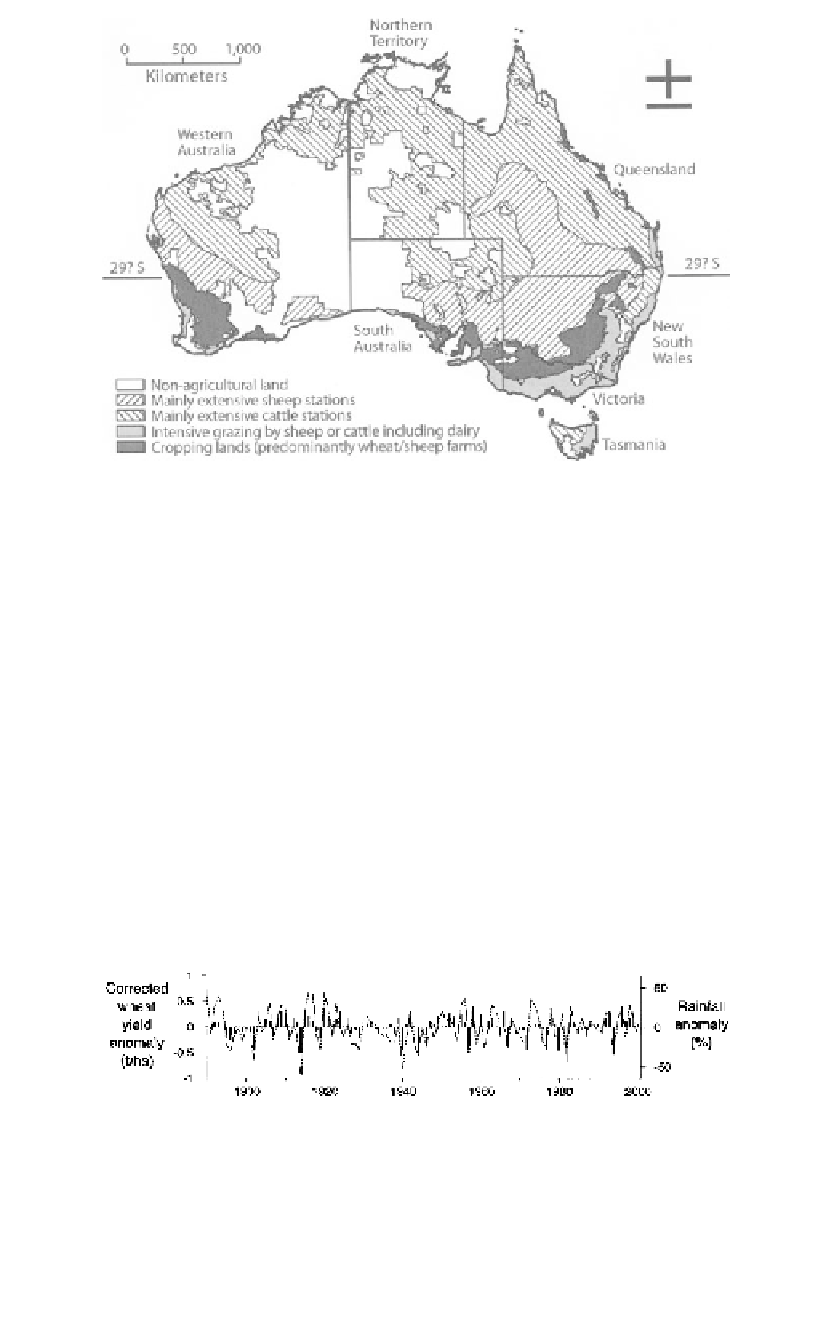
Figure 29.1
Current (2000) land-use in Australia. The entire grazed and cropped region is
drought prone.
w
ith protracted drought. Severe production losses may be tolerated for
on
e year or longer, but when dry conditions persist for several years as
th
ey did, for example, in northeastern Australia from 1991 to 1996, rural
co
mmunities deteriorate, people abandon the land, and the suicide rate in
ru
ral areas increases (Stehlik et al., 1999). Impacts are also evident at a na-
tio
nal scale, particularly when droughts are widespread or centered on the
m
ost productive regions at critical times. For instance, the extremely dry
w
inters of 1902, 1914, 1940, 1944, 1982, and 1994 saw large reductions
in
national wheat yields (figure 29.2).
One of the most serious failures of the wheat crop occurred in 1982.
It
is estimated that the 1982-83 drought cost Australia in excess of U.S.
$1
.5 billion, resulting mainly from the failure of the 1982 wheat crop. Ap-
pr
oximately 60% of all farms in Australia involved in cropping or grazing
w
ere affected by drought during this period (Purtill et al., 1983), and the
[371
Figure 29.2
A comparison of annual anomalies in the national wheat yield corrected for a
rising trend in yields (bars) and percentile growing season (May-October) rainfall for the
cro
pping region (figure 29.1).


Search WWH ::

Custom Search