Agriculture Reference
In-Depth Information
1
2
3
4
5
6
7
8
9
10
11
12
13
14
15
16
17
18
19
20
21
22
23
24
25
26
27
28
29
30
31
32
33
34
35
36
37
38
39
40
41
42
43
44
45
46
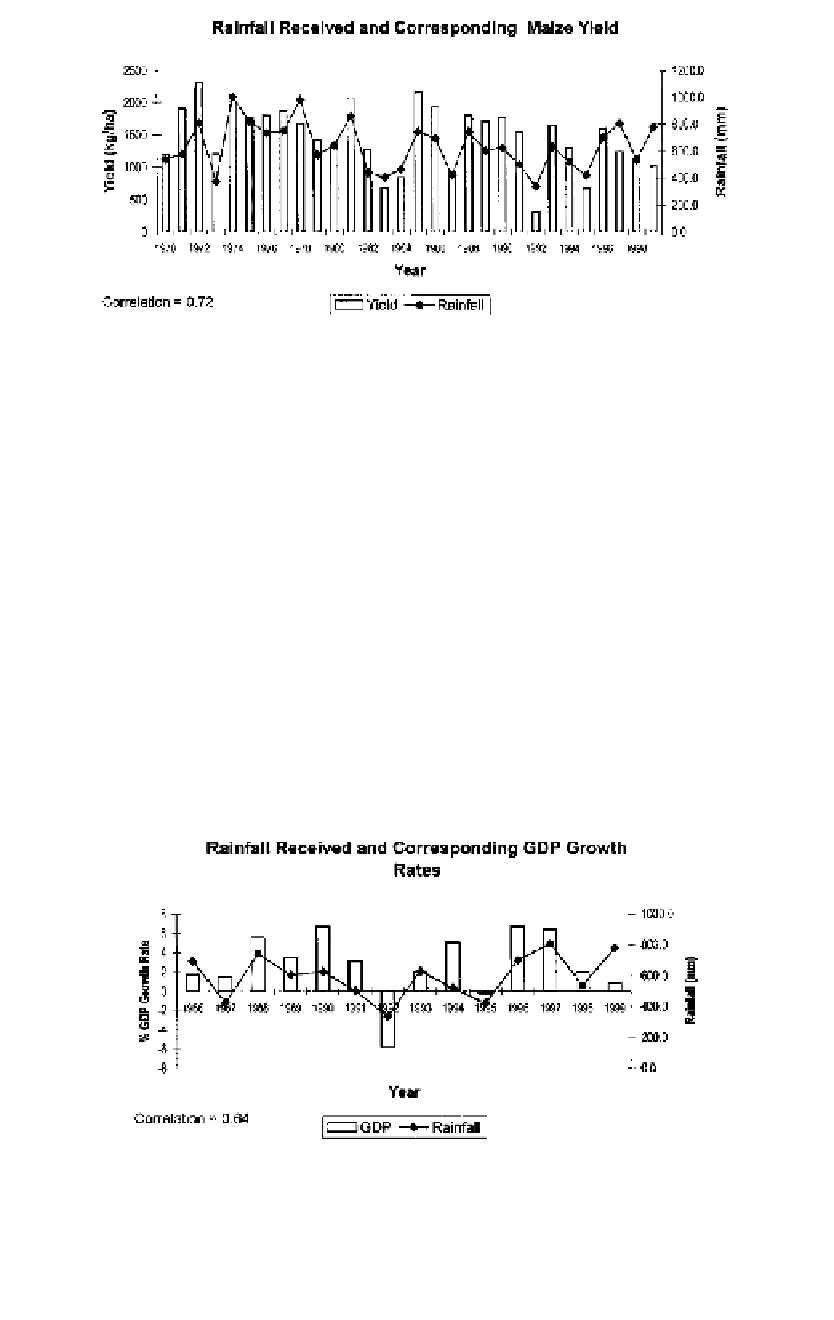
Fig
ure 20.2
Time series of Zimbabwe smallholder-farming sector maize yields and annual
rainfall from 1970 to 1999.
[269
ov
er Zimbabwe, for example, exceeds 40% in the drier west and south-
w
est sections of the country and is below 25% in the north (figure 20.5).
R
ecent studies of interannual rainfall variability over southern Africa have
de
monstrated their periodic nature. Historical rainfall records generally
sh
ow spectral peaks in five bands, 2.2-2.4, 2.6-2.8, 3.3-3.8, 5-7, and 17-
20
years (Nicholson, 1986; Makarau and Jury, 1997). It has been argued
th
at these periodicities in annual rainfall are indicative of the influence of
th
e Quasi-Biennial Oscillation, ENSO, periodic sea-surface temperature os-
ci
llations, and the luni-solar cycles (Nicholson, 1986; Makarau and Jury,
1997).
Line
——
0.0
——
Norm
PgEn
[269
ENSO
C
onsiderable evidence exists that phase shifts in the ENSO are accompa-
ni
ed by rainfall anomalies across southern Africa (Ropelewski and Halpert,
Figure 20.3
Response of Zimbabwe's GDP growth rate to rainfall.


Search WWH ::

Custom Search