Agriculture Reference
In-Depth Information
1
2
3
4
5
6
7
8
9
10
11
12
13
14
15
16
17
18
19
20
21
22
23
24
25
26
27
28
29
30
31
32
33
34
35
36
37
38
39
40
41
42
43
44
45
46
[260
Line
——
4.7
——
Norm
PgEn
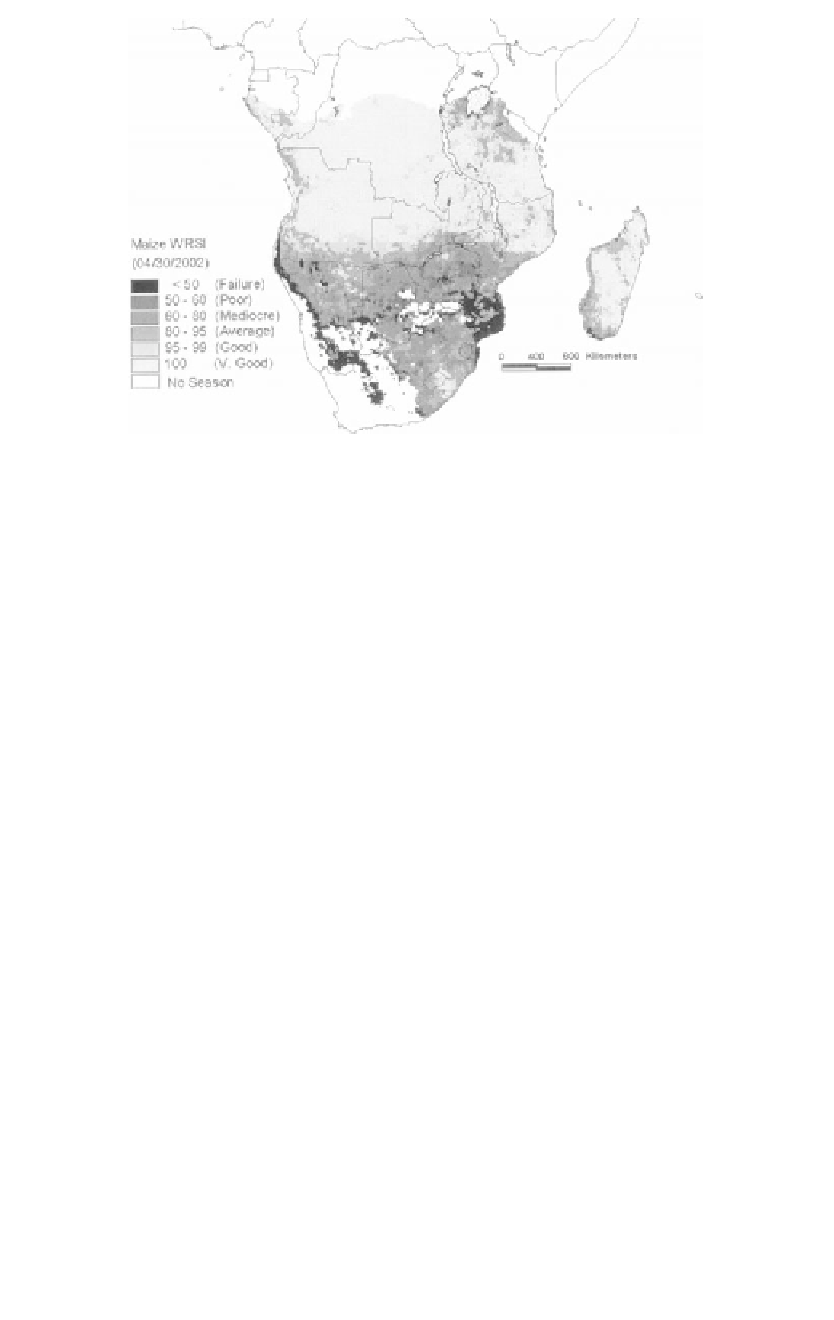
Figure 19.3
Maize WRSI at the end of April 2002 during the 2001-2002 growing season.
The average period index (PI) is obtained by averaging the DI over the
pe
riod in question for NDVI and RFE. For example, if we consider the first
pe
riod for those base units that fall into the very early agroclimatological
zo
ne, the averaging period will be from the second dekad of May to the
th
ird dekad of June; i.e.,
[260
DI
/
N
PI
=
[19.5]
w
here DI is summed from the beginning dekad to the ending dekad, and
N
is the number of dekads.
PI values for NDVI and RFE are combined to obtain a growing-condi-
tio
n period index (GCPI) for each period. These GCPIs could be mapped
to
analyze the three parts of the growing season separately (the sowing
pe
riod, the vegetative growth period, and the maturation period). Finally,
an
average of the three GCPI is calculated to obtain a growing season index
ca
lled the RNCD. High values of the RNCD thus obtained are indicative
of
good rain-fed crop production. One should note that because of the low
N
DVI for water, flooded plains show a low RNCD. That is why RNCD
is
used to assess the seasonal outcome where rain-fed crops and pastures
ar
e predominant, as opposed to areas where recessional agriculture is pre-
do
minant.
Evaluation of RNCD
At the end of the growing season, the RNCD in-
dex was used to diagnose the 2001 growing season for rain-fed agricul-
tural conditions (crops and pastures) and possible outcome. The results
presented here represent the preharvest assessment for rain-fed crops and


Search WWH ::

Custom Search