Agriculture Reference
In-Depth Information
1
2
3
4
5
6
7
8
9
10
11
12
13
14
15
16
17
18
19
20
21
22
23
24
25
26
27
28
29
30
31
32
33
34
35
36
37
38
39
40
41
42
43
44
45
46
[242
Line
——
-1.1
——
Long
PgEn
[242
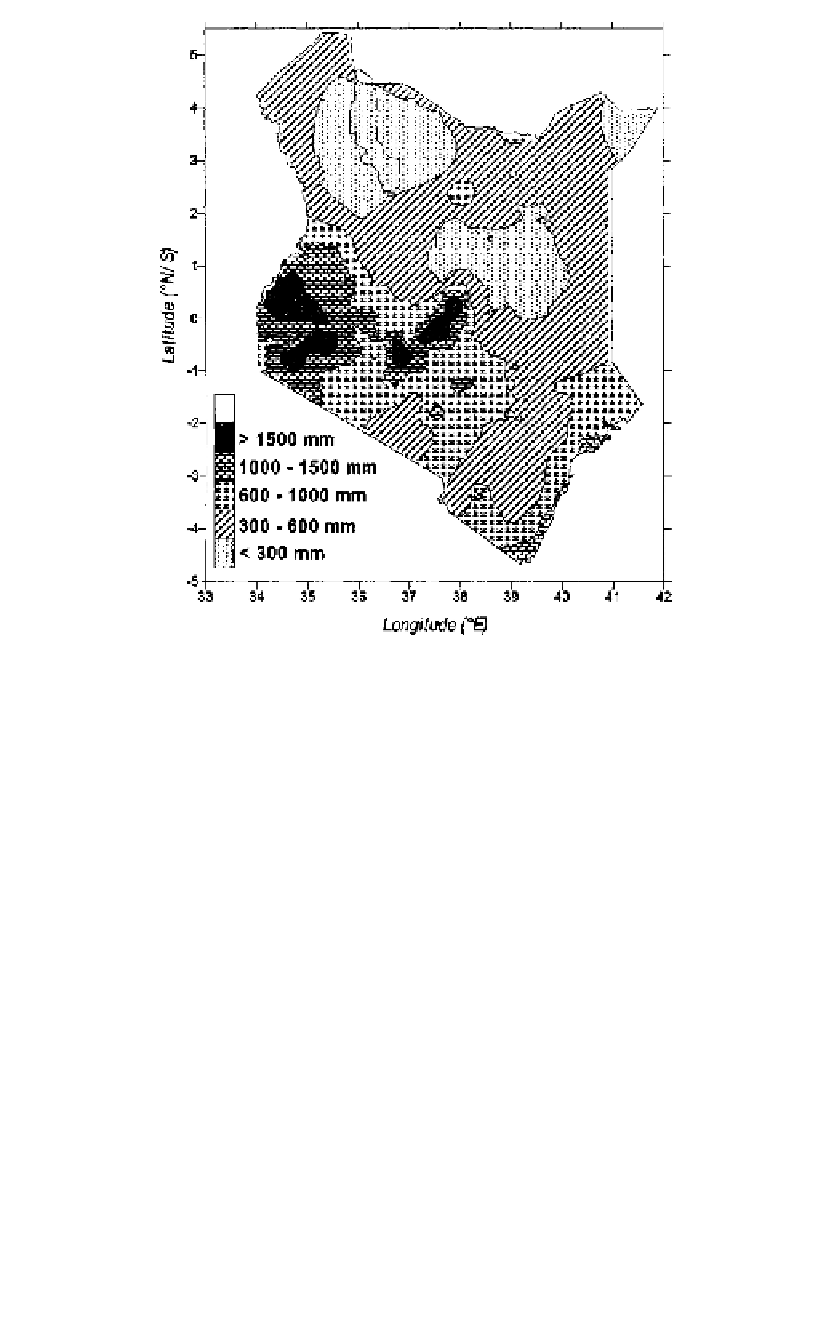
Figure 18.2
Annual rainfall distribution in Kenya.
(mm),
P
i
is indiv
id
ual monthly precipitation (mm),
P
is mean annual p
re-
cipitation (mm),
R
is soil water recharge (mm),
L
is soil water loss (mm),
PE
is annual potential evapotranspiration (mm), and
τ
is number of months.
Based on this index, one can characterize the monthly conditions as ranging
from extreme wetness (index value
>
4) to extreme drought (index value
<
-4), as shown in table 18.1.
Quartile Drought Index
Using this method, historical records are first
standardized (based on the specific long-term mean, standard deviation,
and sometimes higher order statistics), ranked, and then divided into four
groups based on quartiles, as shown in table 18.2. All new observations
are then classified into one of these groups based on the magnitude of the
specific observations. Assessment of drought severity in the GHA is based
on the quartile index. Cumulative monthly rainfall is used to assess the
persistence of drought. Figure 18.5 compares the worst drought conditions
that occurred during 1984 and 2000 on the basis of cumulative rainfall.
The 2000 drought was associated with a La Niña event due to the ob-
served slow cooling of sea-surface temperatures over much of the tropical
Indian Ocean. Chapter 3 describes such atmospheric conditions in detail.


Search WWH ::

Custom Search