Agriculture Reference
In-Depth Information
1
2
3
4
5
6
7
8
9
10
11
12
13
14
15
16
17
18
19
20
21
22
23
24
25
26
27
28
29
30
31
32
33
34
35
36
37
38
39
40
41
42
43
44
45
46
[189
Line
——
0.3
——
Long
PgEn
[189
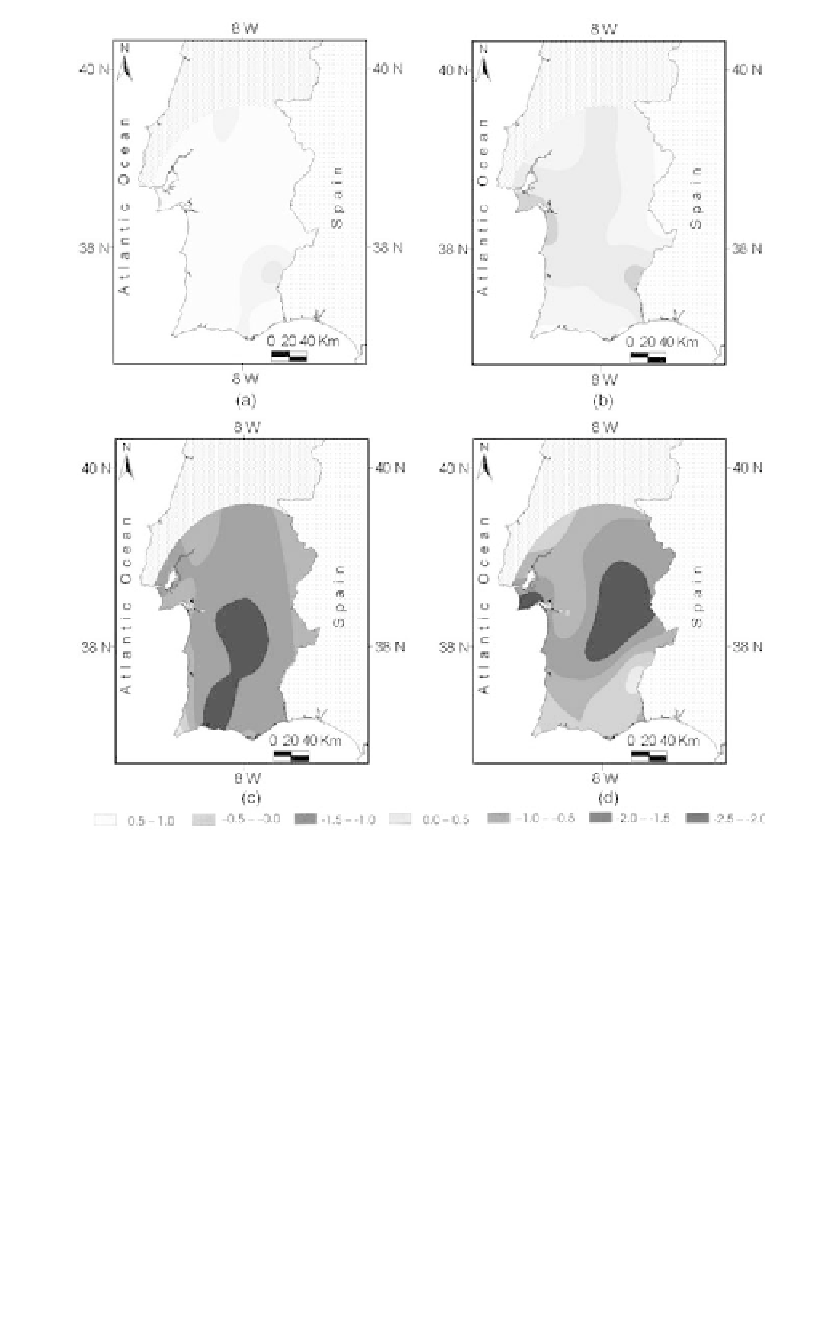
Figure 14.4
Average March Palmer drought severity index for (a) 1961-70, (b) 1971-80, (c)
19
81-90, and (d) 1991-2000 (from Pires, 2003).
D
rought Monitoring Using Satellite Data
The Portuguese Meteorological Institute (IM) routinely calculates normal-
ized difference vegetation indices (NDVI) based on the National Oceanic
and Atmospheric Administration's Advanced Very High Resolution Ra-
diometer (AVHRR) satellite data (Tucker and Sellers, 1986; Gomes et al.,
1989; Duchemin and Maisongrande, 2002; chapters 5 and 6) to quantify
vegetation stress and monitor droughts. Since 1987 drought effects have
been monitored on the main region of cereal winter crops in Alentejo.
Usually, only one parameter (NDVI) is used to monitor land, which fails
to fully characterize the surface. Thermal infrared channels can provide


Search WWH ::

Custom Search