Agriculture Reference
In-Depth Information
1
2
3
4
5
6
7
8
9
10
11
12
13
14
15
16
17
18
19
20
21
22
23
24
25
26
27
28
29
30
31
32
33
34
35
36
37
38
39
40
41
42
43
44
45
46
cereal yield assessment for 49 administrative units was about 4%. The re-
sults of cereal yield estimation were accepted by agricultural experts and
statisticians, creating a basis for operational crop condition assessment
in Poland with the use of remotely sensed data. In addition, using TCI,
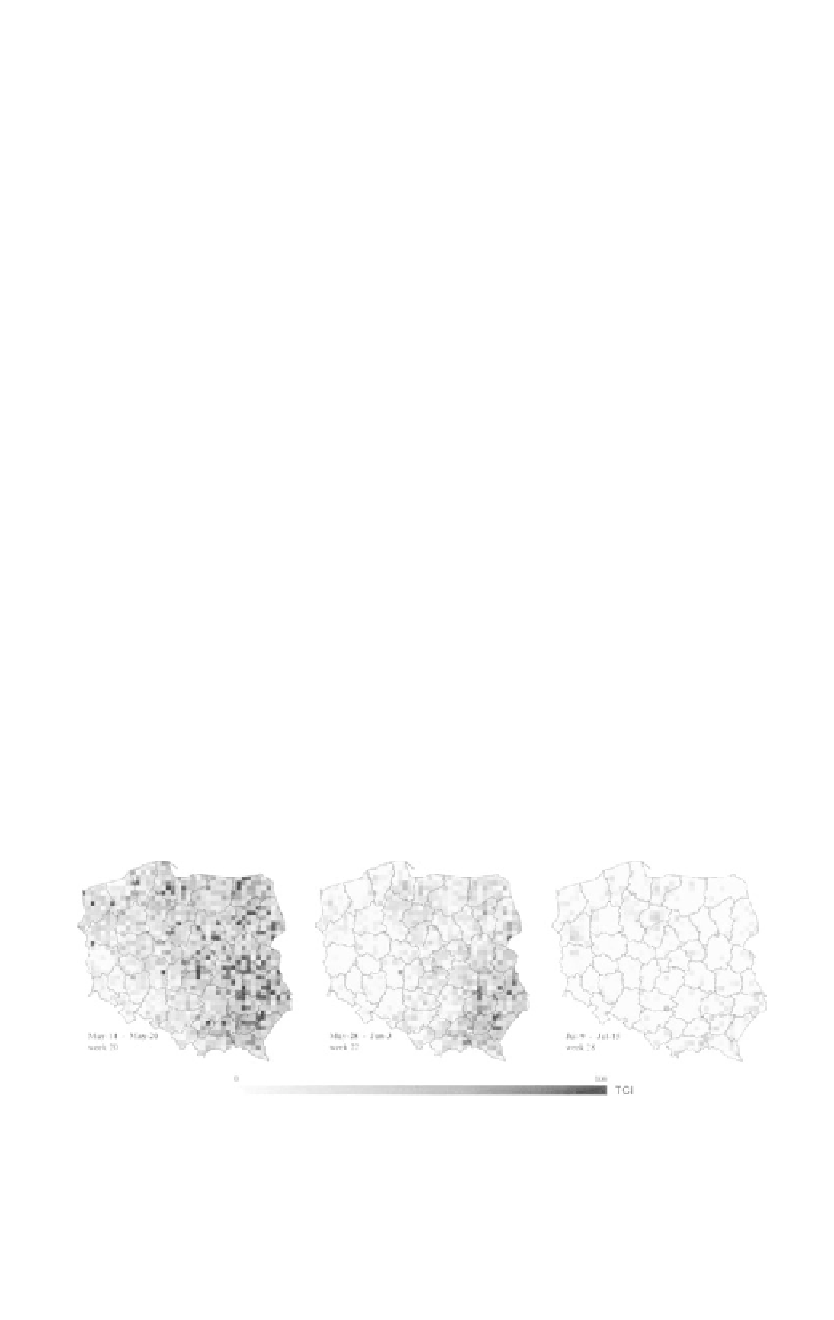
the 1992 drought was also detected effectively, as shown in figure 13.5
(Dabrowska-Zielinska et al., 1998, 2002). It can be seen from figure 13.5
that western part of Poland was affected by drought already in May.
Two important phases of crop development had the highest correlation
with crop yield. The increase of water demand by plants responds to the
increase of sensitivity of TCI during these periods. The period of significant
correlation during early summer (Julian week 22-25) is critical because
cereals pass through reproductive phases, when cooler weather is favorable
for crop development and yield formation. The second important period
was spring (week 14-16); the negative correlation for this period indicates
the low temperature during spring yields of cereals in Poland. It was also
found that TCI could be used to interpret soil moisture conditions over
large areas.
The data used in the above system were based on using 4-km GAC
(global area coverage) NOAA/AVHRR data (
www.saa.noaa.gov/cocoon/
nsaa/products/)
for global monitoring of crop and drought conditions.
However, the diversified cropping and small land holdings that characterize
Polish agriculture make 1-km LAC (local area coverage) NOAA-AVHRR
data more useful for monitoring drought conditions. The research for
this purpose began in cooperation with the Canada Centre of Remote
Sensing, Ottawa
(www.ccrs.nrcan.gc.ca),
in 1996. The global land data (1-
km resolution) collected under International Geosphere Biosphere Program
for 1992-95 were used for this research. A Geographic Information System
database was developed and used for making regression analyses and for
determining relationships between indices derived from remotely sensed
data and parameters characterizing agricultural production (Walker, 1988;
Wood, 1993; Yang et al., 1997; Boken and Shaykewich, 2002).
[176
Line
——
1.6
——
Shor
PgEn
[176
Figure 13.5
Development of drought conditions in Poland in 1992, characterized by tempera-
ture condition index.


Search WWH ::

Custom Search