Agriculture Reference
In-Depth Information
1
2
3
4
5
6
7
8
9
10
11
12
13
14
15
16
17
18
19
20
21
22
23
24
25
26
27
28
29
30
31
32
33
34
35
36
37
38
39
40
41
42
43
44
45
46
[173
Line
——
1.7
——
Norm
PgEn
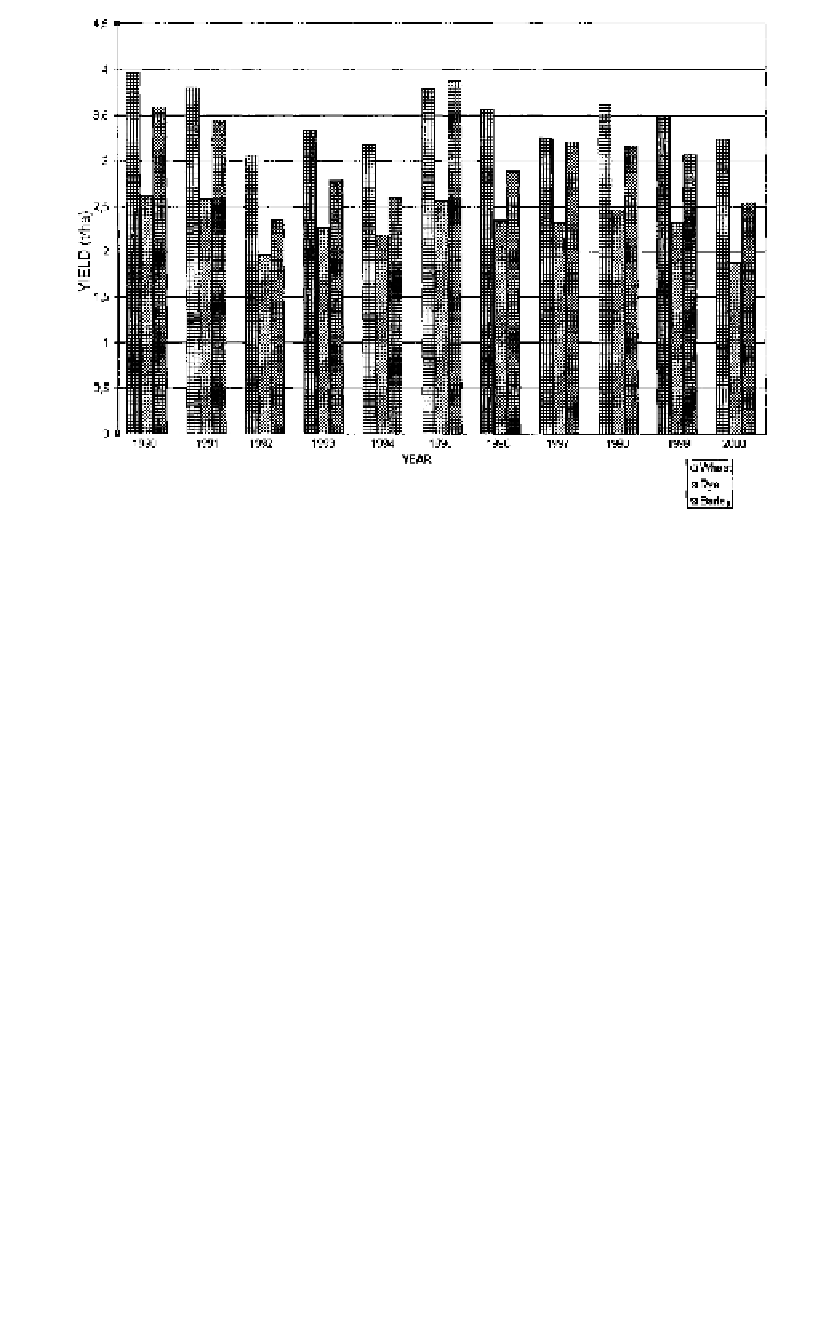
Figure 13.2
Average yield of the main cereals in Poland.
September). In Poland, the index ranges from 1.6 for areas heavily prone
to drought to 1.0 for areas where sum of summer precipitation exceeds
potential evapotranspiration. Such areas exist in mountainous regions in
southern Poland and are characterized by high rainfall in summer months.
In addition, field-level assessment of potential yield of crops is done several
times throughout the growing season by experts in the Central Statistical
Office. A wealth of information about actual crop conditions is available
from agricultural correspondents posted in different regions of the country
(www.stat.gov.pl).
The results of these predictions are published in official
bulletins and delivered to the Ministry of Agriculture and other govern-
mental agencies throughout Poland.
Until about 1990, drought monitoring was limited to assessing drought
conditions as described above as well as by studying agrometeorological
data collected from 60 meteorological stations across Poland. Drought is
considered to have occurred if some threshold conditions are met. Agrom-
eteorological variables and the threshold conditions (in parentheses) are
(1) precipitation deficit from April 1 to September 1 (<50% of multiyear
mean); (2) precipitation deficit during the 3 dekads (1 dekad
[173
10-day
period) preceding the drought (<25% of multiyear mean); (3) the number
of successive nonrainy days (>17); (4) the difference between total precipi-
tation and evapotranspiration from June 1 to September 1 (
<
75 mm); (5)
number of days for which the mean daily soil temperature at 5-cm depth
=


Search WWH ::

Custom Search