Agriculture Reference
In-Depth Information
1
2
3
4
5
6
7
8
9
10
11
12
13
14
15
16
17
18
19
20
21
22
23
24
25
26
27
28
29
30
31
32
33
34
35
36
37
38
39
40
41
42
43
44
45
46
[164
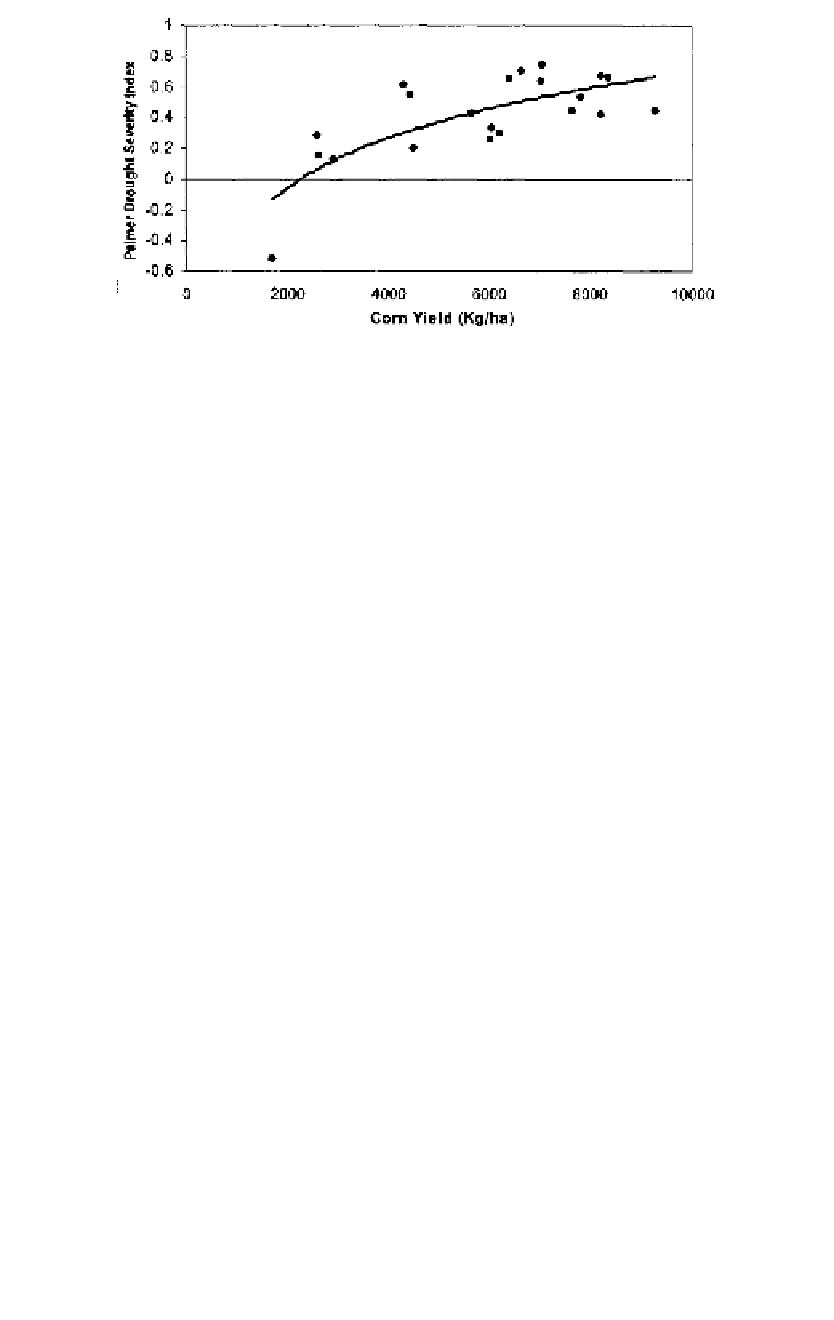
Figure 12.5
The relationship between Palmer drought severity index and corn yield.
Line
——
-0.2
——
Norm
* PgEn
Study and Research on Agriculture (CEPAGRI—Unicamp;
www.cpa.uni
camp.br)
and mainly by the National Institute of Space Research (Instituto
Nacional de Pesquisas Espaciais,
www.inpe.br,
which are trying to develop
technologies for monitoring agricultural droughts.
A
grometeorological Warning System
The Instituto Agronômico de Campinas (IAC) of the Agriculture and Sup-
ply Department began an Operational Advisory System in 1988 to aid
agricultural activities. The counseling and agrometeorological analyses are
conducted by the CIIAGRO (Brunini et al., 1996). This system, a net-
work of 128 weather stations across the state of S ao Paulo, is an opera-
tional framework that provides agrometeorological information to farmers
and extension services in regard to soil type, crop development, agricul-
tural practices, pest management, irrigation requirements, climatic risks
(frost, drought, dry spell), water balance, crop yield, and weather forecast.
In short, the information disseminated by the system can be used by the
agribusiness community for decision making about agricultural practices,
food production and civil defense, and drought preparedness and miti-
gation (Brunini et al., 1998). Using daily temperature and precipitation
data twice a week from the weather stations, the system executes a water-
balancing approach (Thornthwaite and Mather, 1955), as well as the rela-
tionships between the ratio AE/PET and available soil water. Weekly maps
describing drought conditions, dry spells, crop development and climate
anomalies are issued. More details can be obtained from the CIIAGRO's
Web site
(http://ciiagro.iac.br).
Figure 12.6 is a sample of the product used
for monitoring droughts using some of the drought indices for the state of
Sao Paulo; figure 12.6a shows drought conditions for one month period
using SPI (SPI-1), whereas figure 12.6b indicates drought conditions based
on the weekly CDI.
[164


Search WWH ::

Custom Search