Agriculture Reference
In-Depth Information
1
2
3
4
5
6
7
8
9
10
11
12
13
14
15
16
17
18
19
20
21
22
23
24
25
26
27
28
29
30
31
32
33
34
35
36
37
38
39
40
41
42
43
44
45
46
Table 12.1 Production losses due to climate anomalies including
droughts that occurred in Brazil during 1978-85 (Mota, 1987)
and 1991-94 (Rossetti, 2001)
Percentage of loss
1978-85
1991-94
Crop
Entire Brazil
Entire Brazil
Northeastern Brazil
Corn
23
41
71
Soybeans
29
23
—
Rice
37
47
Beans
32
41
Average
26
33
53
[159
in
drought monitoring is FUNCEME (Fundaç ao Cearense de Meteorolo-
gi
a, Ceará State Meteorological Foundation), in northeastern Brazil. The
FU
NCEME carries out research on monitoring and conducting a hydro-
m
eteorological surveillance in the northeast Brazil; however, no specific
in
dices are used to monitor droughts. Recently, the Agronomic Institute
in
S ao Paulo state has begun a weekly drought monitoring evaluation by
co
nsidering both agricultural and hydrological aspects. Such an evaluation
w
ill contribute to the development of public policy for drought mitigation
an
d natural disaster preparedness.
Line
——
11.
——
Long
* PgEn
[159
Pr
ecipitation Anomaly from Potential Evapotranspiration
Th
e anomaly of annual precipitation (P) from potential evapotranspiration
(PET),
is
shown
for
some
locations
in
Brazil,
Argentina,
Chile,
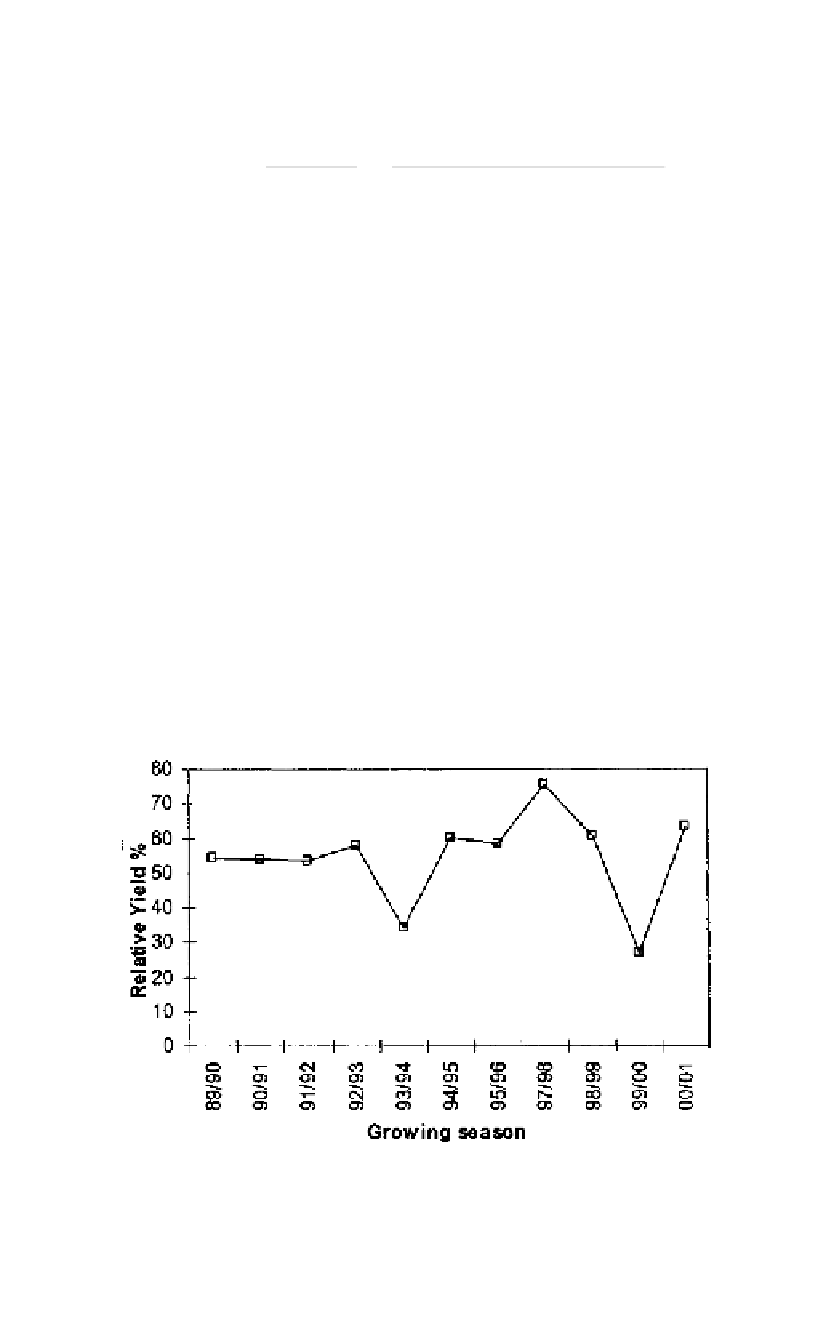
Figure 12.3
The variation in maize production from 1989 to 2000 for the central southern
region of Brazil. Data for 1996-97 was not available.


Search WWH ::

Custom Search