Agriculture Reference
In-Depth Information
1
2
3
4
5
6
7
8
9
10
11
12
13
14
15
16
17
18
19
20
21
22
23
24
25
26
27
28
29
30
31
32
33
34
35
36
37
38
39
40
41
42
43
44
45
46
was determined. Figure 7.3 shows a clear correlation. It is important to
note that at low values of the seasonal
T
B
, there is a lower sensitivity in
S
than at higher values of
T
B
. When error and variance are considered,
this result suggests that the
T
B
is useful for the lower range and that this
corresponds to the vegetated as opposed to semiarid conditions.
Antecedent Precipitation Index
The antecedent precipitation index (API)
is based on the summation of the precipitation for the current day and
the API for the previous day reduced by a moisture depletion coefficient.
Bl
anchard et al. (1981) and McFarland and Harder (1982) performed
so
me of the first analysis involving API and satellite-based microwave
br
ightness temperature. Using higher frequency microwave data (19 GHz)
co
llected by the electronically scanned microwave radiometer (ESMR),
th
ey examined relationships in the Southern Great Plains (SGP) region of
th
e United States. They found, for major wheat-producing regions, that
dr
ought conditions and, to a degree, soil moisture conditions, could be
de
tected before the full canopy development and after the harvest. At full
ca
nopy stage, the microwave measurement at this frequency was related to
the moisture condition of the canopy. The key result was that a correlation
existed between
T
B
and API for low levels of vegetation.
There have been attempts to relate API to
T
B
using data from nearly all
the passive microwave satellite systems that have flown in space. Choud-
hury and Golus (1988) used SMMR data. They broadened the ESMR
analysis to longer wavelengths and an extended period of time. They also
looked at the SGP but over a larger region with varying vegetation levels.
These authors noticed a vegetation effect on the relationship between
T
B
and API. The next step in much of the research was to develop regression
[101
Line
——
-1.1
——
Norm
PgEn
[101
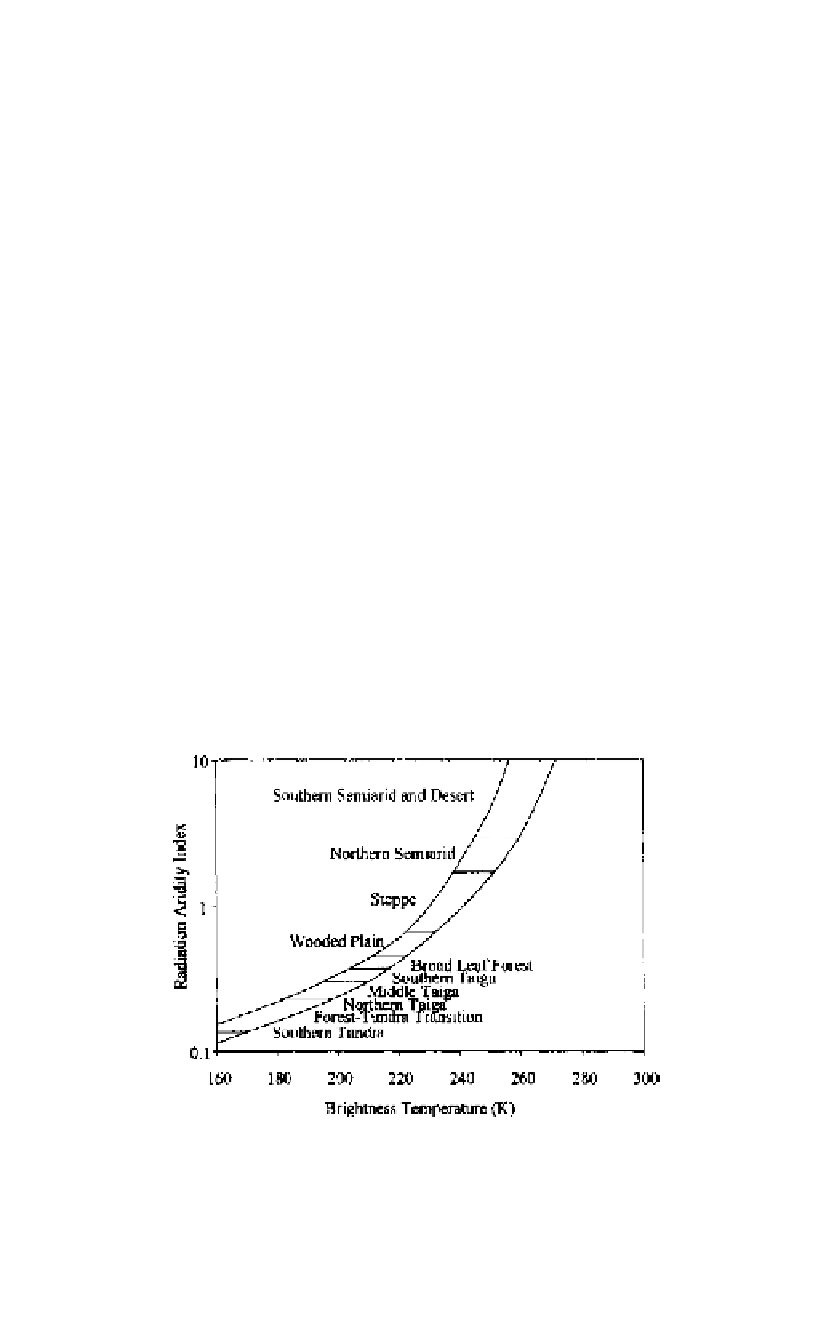
Figure 7.3
Relationship between the radiation aridity index and microwave brightness tem-
pe
rature for different climatic zones (Reutov and Shutko, 1987).


Search WWH ::

Custom Search