Information Technology Reference
In-Depth Information
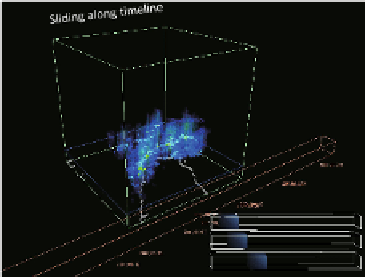
TRMM PR (rainfall strength)
Ikebukuro
Ueno
Shinjuku
secon
Shibuya
Filter for data
Transparency control
Dot size control
(a) Visualizing temporal changes in rainfall
strength over Taiwan
(b) Visualizing temporal changes in amount of
tweets in Tokyo aer Earthquake
Fig. 8.
Example of visualizing temporal changes in values on 3D/2D geographical space
these nodes to find details on announcements and products that were released,
and we then find that they announced a 'new price plan' in the first peak,
and released 'product A' in the second peak. However, although 'Telco B' also
announced new products very frequently, there are few peaks related to events
'switch' for 'Telco B'. These results mean that 'Telco A's' marketing activities
had more impact in Japan than those by 'Telco B'.
Fig. 8 shows examples of visualizing temporal changes in values on 3D/2D
geographical space. Fig. 8 (a) visualizes temporal changes in rainfall strength
over Taiwan around typhoon season in which data is collected through DIAS
project
2
. We can recognize rain concentrates along shoreline of Taiwan. Fig. 8
(b) visualizes temporal changes in amount of tweets in Tokyo after Earthquake on
March 11, 2011. We can recognize that many people tweets whole through night
around main stations in Tokyo because transportation systems stopped. We can
also find out each station such as Shibuya, Shinjuku, Ueno, and Ikebukuro shows
different trends in frequencies of tweets.
We have proposed an interactive visualization system to extract networks of
historical figures from historical data and to show time-varying changes in their
relationships [5] (Fig. 9). We use red for clusters related to “adversarial relation-
ship” or “battle”, blue for clusters related to friendship, green for others, and
gray for keywords that are not categorized in any clusters. Fig. 9 shows tempo-
ral changes in characteristics of selected relationships between historical figures
3
.
Fig. 9 (b) shows red edges between TOKUGAWA Ieyasu and TAKEDA Kat-
suyori. These represent their relationships in continual battles. Fig. 9 (c) shows
changes in the relationship between ODA Nobunaga and UESUGI Kenshin for
each year. Fig. 9 (d) visualizes complex relationships between Nobunaga and
ASHIKAGA Yoshiaki.
3
They are powerful territorial lords in pre-modern Japan.