Information Technology Reference
In-Depth Information
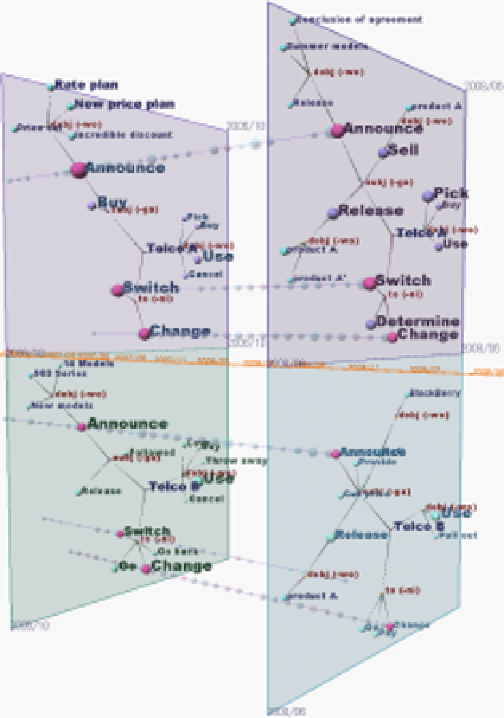
2008/06
TimeSlices for different months
2006/10
Selecng and expanding
Timeline
TimeFluxes
Fig. 7.
Comparing Marketing Effect of two Telcos
in sentences [6]. The upper TimeSlice shows a topic for 'Telco A', while the
lower one shows a topic for 'Tepco B'
1
. We can recognize events related to
'change/switch to Telco A' are more popular than 'change/switch to Telco B' in
most months by observing changes in the structure and frequencies for events.
To start exploring possible reasons for such actions and plans, we first find times
when events “change/switch to Telco A” are popular, and then observe events
around them on the TimeSlice in detail. We can see that there are some peaks
in the events 'switch to Telco A' by observing the size of the spheres on the
TimeFluxes. We place TimeSlices at the left on the position of timing when
the first peak is observed (October 2006), and TimeSlices at the right for the
second peak (June 2008). We find that 'Telco A' announced or released something
because the size of the 'announce' and 'release' nodes increased. We next expand
1
Companies' names have been anonymized.