Information Technology Reference
In-Depth Information
Space Fill
Representation model
Ball and Stick
Representation model
EyePosion
EyeCenter
synchronizing view navigaon
: panning and zooming
Copy cell
Copy cells
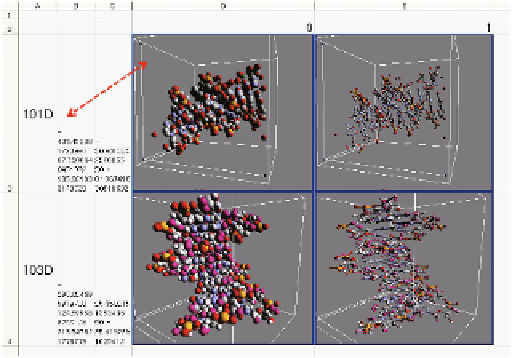
Fig. 4.
Multiple visualizations of 3D structure of protein and/or DNA
Fig. 4 shows an example of visualizing 3D structures of protein/DNA using
multiple data-sets, visual representations and angles. We can get the 3D struc-
ture data-sets for protein and DNA through Web service. In this example, we
first input a PDB ID to visualizer components [3] in 3D environments through a
cell. We can copy visualizations just through copying the cells to compare vari-
ous data-sets with different representations. Visualizations of each row can have
the different data-sets. We can change the 3D representation of protein structure
just by inputting a template ID into the range D1:E1. We can also synchronize
angle of view rendering among different cells through sharing parameters.
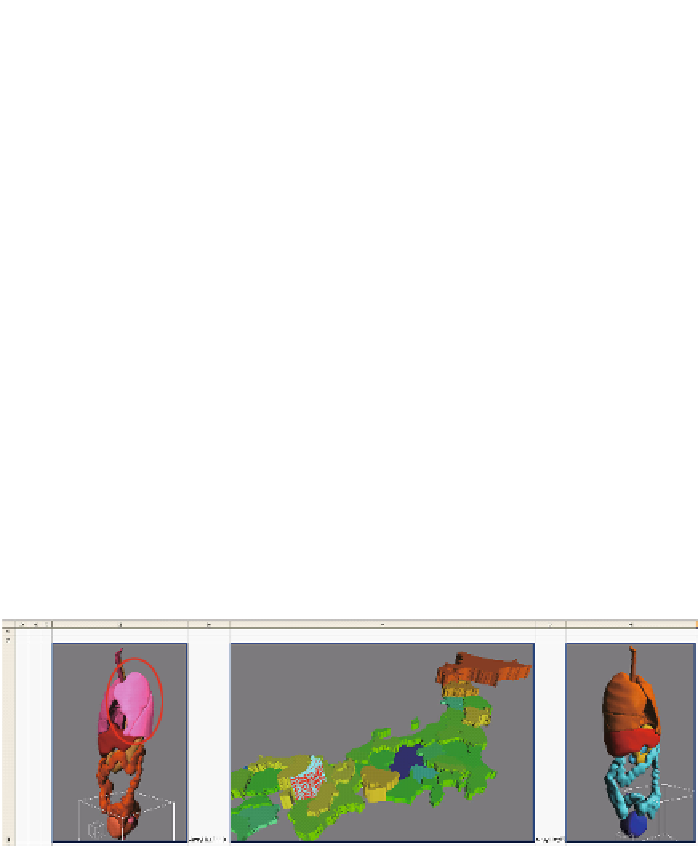
(ii). Visualizing cancer mortality of each organ at 1999
about the selected prefecture using a 3D HeatMap
(i). Visualizing cancer mortality of
each prefecture at 1999 about the
selected organ using block map
with heatmap
H3
D3
F3
Selected organ ID
Selected prefecture ID
Fig. 5.
An example of visualizing cancer mortality of each prefecture and of each organ