Information Technology Reference
In-Depth Information
the same route may fall in different clusters on a day with heavy snow fall. In summer
time, they almost fall into the same cluster. This means that the influence of snow on
each road segment may follow different models even on the same route. Therefore,
we may think that influence of snow on traffic in the whole city cannot be modeled by
a single monolithic model covering the whole city. It should be considered as a
complex system of different models each of which may be a simple monolithic
model. In order to obtain meaningful knowledge from such a complex system, we
first need to find out a set of subsystems modeled by the same monolithic model or
same type of models. This situation is quite similar to the analysis of clinical trial
data, in which it is very important to find out a specific case of patients, for which one
of the treatment arms after the randomization shows a significantly better
performance than the others, to find out personalized medical treatments.
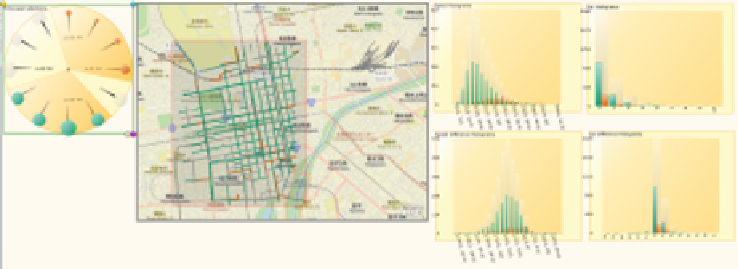
Here we also exploit an exploratory visual analytics approach. Figure 15 shows the
geospatial digital dashboard system we developed for the exploratory visual analytics
of the probe car and probe person data in comparison with time, area, snow fall, snow
plowing and removing, traffic accidents, and weather conditions. Figure 15 has a 24
hour clock on which you can specify any time interval to retrieve those probe car data
during this time interval. It also has a calendar with the weather data of each day. On
this calendar, you can specify only those days with heavy snow. It also shows a map
where probe car data and traffic accident records can be visualized, and you can
specify an arbitrary area of your concern. Each chart on the right hand side show, for
example, the distribution of average speed, car population distribution, and accident
distribution, all in terms of the number of road segments. On each distribution chart,
you can specify a certain range of values to choose only those road segments falling
into this range. The geospatial digital dashboard system enables us to dynamically
change the quantification conditions on each of the various parameters as well as the
spatiotemporal conditions to find out a set of road segments that are similarly
influenced by snow fall, and/or snow plowing and removing. The obtained set will be
used for further analyses based on frequent pattern mining and/or further clustering.
Fig. 15.
Geospatial Digital Dashboard System with a 24 clock, a map visualization, and
charts