Information Technology Reference
In-Depth Information
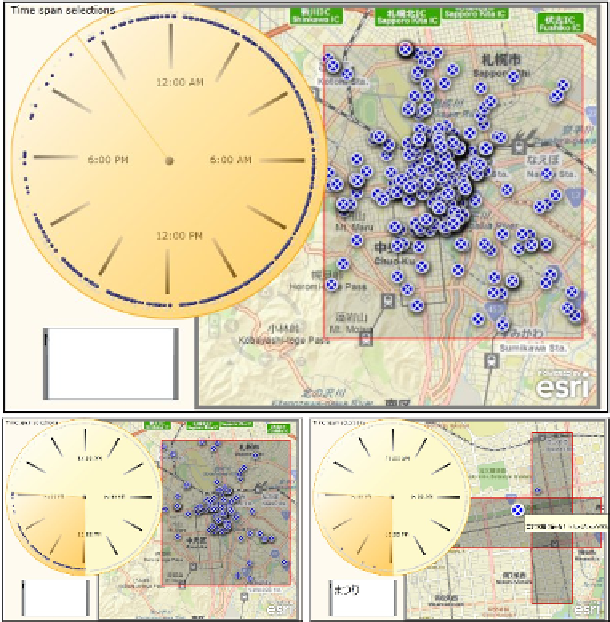
Fig. 2.
Interacting with Twitter data.
Top:
Data contains timestamps (24h clock,
upper left), text (search box, lower left), and GPS tags (map).
Bottom Left:
Selecting
only afternoon data.
Bottom Right:
Restrict to city center areas, zoom in, and show
only tweets with the word “matsuri” (“festival”). Mouse-over shows an individual tweet.
directly connected but the
Dashboard
(parent) Webble listens to slot changes
from its children and reads and sets slot values of the children when appropri-
ate. In Figures 2 and 3, all visible Webbles are visualization components, except
the map which is a Webble developed independently and later wrapped to work
with the
Dashboard
.The
Dashboard
Webble and the data source Webbles are all
invisible, but can be made visible if there is a reason to interact with them.
2.1 Usage Example
Figures 2 and 3 show a simple example of using the
Digital Dashboard
to ex-
plore data from our snow removal project. The user opens the
Webble World
web page
1
and loads the
Digital Dashboard
Webble. The user also loads a data
source Webble for some data collected from Twitter. The data contains short
1
http://www.meme.hokudai.ac.jp/WebbleWorld/WebbleWorldIndex.html