Database Reference
In-Depth Information
ctx.clearRect(0,0,width,height);
ctx.putImageData(img,-w,0);
}
Nothing more is necessary to draw high-performance strip charts. The other
nice feature of this method is that it does not require the data to be stored;
only the last value is stored. If a bar chart were used instead of a strip chart
then not even that value would need to be stored.
Hummingbird
The first real-time application to employ this approach was Hummingbird,
developed by Gilt Group engineers. This application is self-contained, using
a 1x1 pixel on a website to record a “hit.” These hits are stored in MongoDB
and then delivered using a
node.js
app over WebSocket using the
socket.io
library from Chapter 7.
Horizon Charts
A relative of the strip chart is the horizon chart, introduced by Jeffrey Heer,
Nicholas Kong, and Maneesh Agrawala. The idea behind the horizon chart
is to be able to visualize a large number of correlated time-series variables.
Doing this with a few correlated series is easy with strip charts. As the
numberofvariablesgrows,thecompressedverticalspacemakesitmoreand
more difficult to detect changes in each of the strip charts.
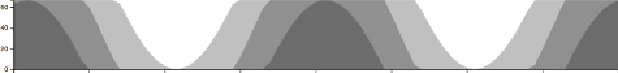
To overcome this problem, the horizon chart uses an area rather than a
line and wraps the values around the y-axis. To avoid having the higher
values get lost, density is used to represent the areas of overlap. The typical
wrapping factor of three, as shown in
Figure 8.2
,
allows plots to take
one-third or less of the original area without losing the ability to see the fine
structure in the plots.
Thecodetocreatetheplotin
Figure8.2
isactuallyquitesimilartorendering
the strip plot. However, rather than render a single line, three overlaid areas
are rendered instead. This function defines each area with the appropriate