Database Reference
In-Depth Information
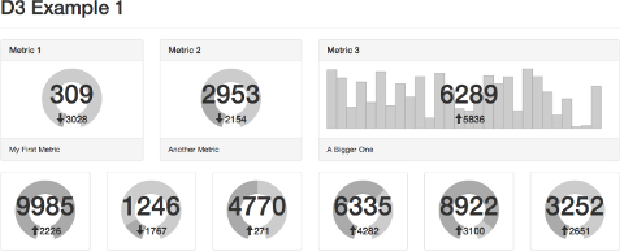
width is set when the rectangle is added because it does not change during
the course of visualization. This results in a dashboard, implemented in
dashboard/public/javascripts/d3.j
s and
dashboard/views/
d3_ex1.jade
like the one shown in
Figure 7.7
:
[[OPEN-LW-CODE80]] var update =
svg.selectAll("rect").data(values);
//Add a new rectangle for each piece of data
update.enter().append("rect").attr("width",dim.width/
(dataLen-1))
update
.attr("x", function(d,i) { return i*dim.width/
(dataLen-1); })
.attr("y", function(d) { return dim.height -
dim.height*(d/max); })
.attr("height", function(d) { return
dim.height*(d/max); })
});
[[CLOSE-LW-CODE80]]
Tore-createsomethinglikethelinechartfromtheoriginalcanvasexamples,
a different approach is required. In this case, a single element (the path)
should be bound to the entire data array. The only time there would be
multiple path elements would be if there were multiple series to be