Biology Reference
In-Depth Information
low-ionic-strength buffer BRB20 (20 mM PIPES, pH 6.8, 1 mM EGTA, 1 mM
MgCl
2
) with 2 mMTCEP and adsorbed to glow-discharged lacey carbon grids (Agar).
A second solution containing 30
m
M DCX and 5
m
M kinesin (K340
T93N
) in BRB20,
2 mMTCEPwas mixed 3:1with colloidal gold (Sigma) and applied to the grids. Grids
were then transferred into a Vitrobot (FEI) set to 37
C and 100%humidity, to prevent
evaporation and consequent changes in ionic strength. They were blotted for 2 s and
instantaneously vitrified by rapid plunging into liquid ethane.
3.2.2.3
Data collection
For each tomogram, 61 images of the sample tilted from
60
to
60
were recorded
þ
on a 2k
2k CCD (Gatan) on a Polara microscope (FEI Company) operating at
300 kV, at 6-8
m
m defocus. Seven tomograms were reconstructed using the FEI soft-
ware Inspect3D. Data collection and processing were performed with the generous
help of Dr. Dan Clare (Birkbeck College).
3.2.2.4
Structure determination
A total of 5
m
m of DCX-kinesin-MT tomographic reconstructions were visually
inspected and all were found to be B-lattice 13-pf MTs (
Fig. 3.4
). This validated
the use of B-lattice parameters in subsequent single-particle structure determination
of DCX-MTs.
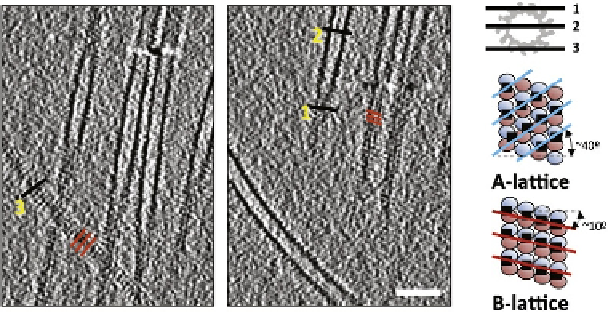
FIGURE 3.4
Cryo-electron tomography of DCX-K-MTs. Two slices of one tomogram containing
longitudinal sections of MTs at different heights (1, 2, and 3), emphasized by a black line in
the pictogram of an MT cross-section on the right. Tangential sections of decorated MTs
(1 and 3) show a distinctive pattern of shallow stripes (red lines) due to the shallow helical path
of kinesin motor domains in B-lattice MTs (see diagrams of A- and B-lattice on the right
of the tomograms;
McIntosh et al., 2009
). Scale bar
¼
50 nm (
Fourniol et al., 2010
).