Biology Reference
In-Depth Information
A
B
cut7.24
ts
mCh-atb2
Interphase MT
Interphase MT
Mitotic MT
6
5
4
3
0
25
50
75
100 s
2
Mitotic MT
1
0
0
20
40
60
80
100
0
5
10
15
20 s
Time (s)
D
C
cut7.24
ts
mCh-atb2
cut7.24
ts
mitotic MT
cut7.24
ts
csi2
Δ
mitotic MT
2
1.5
0
5
10
15
20 s
cut7.24
ts
csi2
Δ
mCh-atb2
1
0.5
0
0
5
10
15 20
25 30
35 40
Time (s)
0
10
20
30
40 s
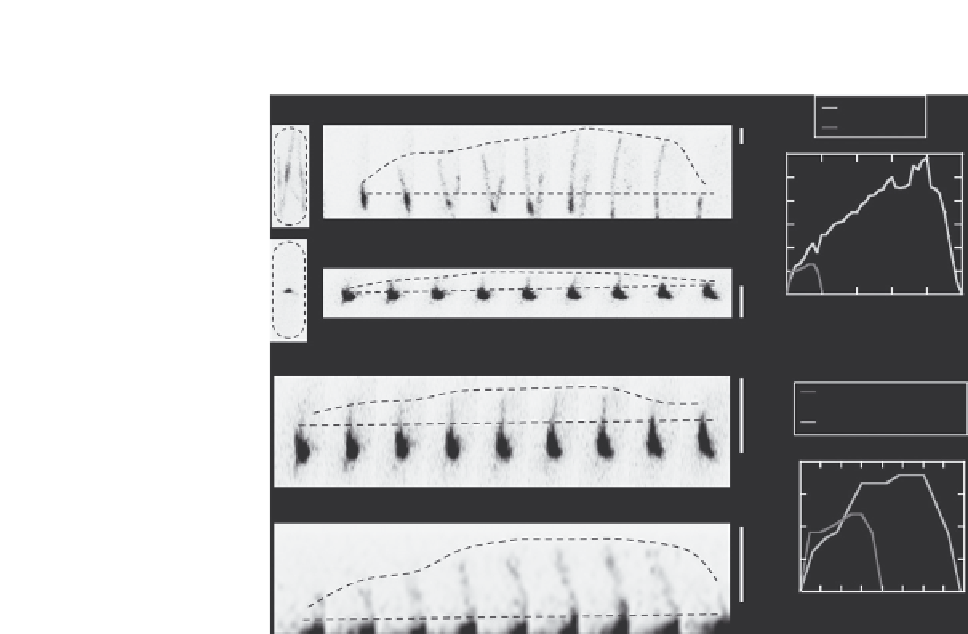
FIGURE 24.2
High-temporal resolution imaging of interphase and mitotic microtubules. (A) Control
cut7.24
ts
cells expressing mCherry-atb2 were imaged at 37
C. Z-stacks (4 sections, 0.5
m
spacing) are captured at 2-s intervals. Shown are maximum projection time-lapse images of
an interphase and mitotic microtubule. Bar: 2
m
m. (B) Length versus time plot of the
interphase and mitotic microtubule shown in (A). (C) Shown are maximum projection time-
lapse images of a mitotic microtubule from the control cut7.24
ts
cell, and the mutant
cut7.24
ts
:csi2
m
cell expressing mCherry-atb2 imaged at 37
C. Bar: 2
D
m
m. (D) Length versus
time plot of the mitotic microtubules shown in (C).
mutation. Nevertheless, at the nonpermissive temperature, both mutants have mono-
polar spindles. Qualitatively, the monopolar spindles of the mutants exhibit seem-
ingly longer microtubule protrusions than the control. This suggests that csi1p
and csi2p may regulate spindle microtubule dynamics.
Figure 24.2
A shows comparative length differences between an individual inter-
phase microtubule and an individual mitotic microtubule of the control cut7.24
ts
cell. The individual interphase microtubule, due to its long length and few adjacent
confounding neighbor microtubules, is relatively easy to track. In contrast, the