Biology Reference
In-Depth Information
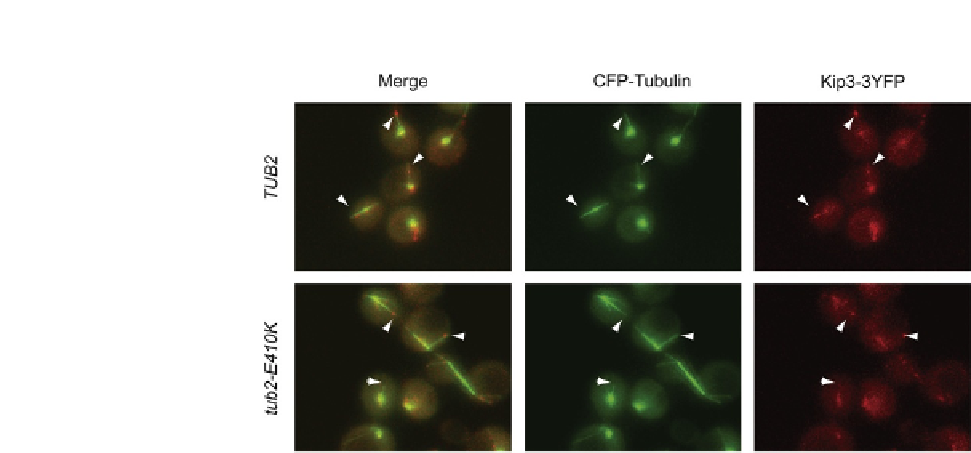
FIGURE 22.5
Microtubule plus-end localization of the kinesin Kip3 on microtubules bearing the b-tubulin
E410K substitution (bottom row). Quantitative analysis determined that Kip3-3YFP at
microtubule plus-ends (arrowheads) was reduced by 80% in the mutant strain relative to
control cells (top row). Microtubules and Kip3 were visualized with CFP-Tub1 and Kip3-3YFP
fusions, respectively (
Cederquist et al., 2012
).
than filter wheel with shared dichroic. Care must be taken that z-series include the
entire cell. Capture all images with identical settings, for example, excitation inten-
sity, exposure times, and microscope/camera configuration.
The precise localization and dynamics of different microtubule-associated pro-
teins can vary extensively. Thus, a detailed discussion of analyses is prohibitive.
Here, we describe an example where localization of Kip3-3YFP to microtubule
plus-ends was quantified (
Fig. 22.5
). Z-series images were deconvolved and merged
to create a single summed image with Slidebook software (Intelligent Imaging
Innovations). A circular region of 12 pixels was designated over the plus-ends of
visible microtubules, and the average YFP intensity was calculated with the same
software. Cytoplasmic background signal was determined and subtracted by calcu-
lating the YFP intensity of an identical region placed in the cytosol near each micro-
tubule plus-end. To determine average Kip3-3YFP localization,
100 microtubules
were measured on multiple days from three wild-type or mutated tubulin clones.
Acknowledgments
We thank E. Murphy, K. Proudfoot, and R. Rizk for helpful comments on the manuscript. We
regret not having space to cite many important works in this field.