Biology Reference
In-Depth Information
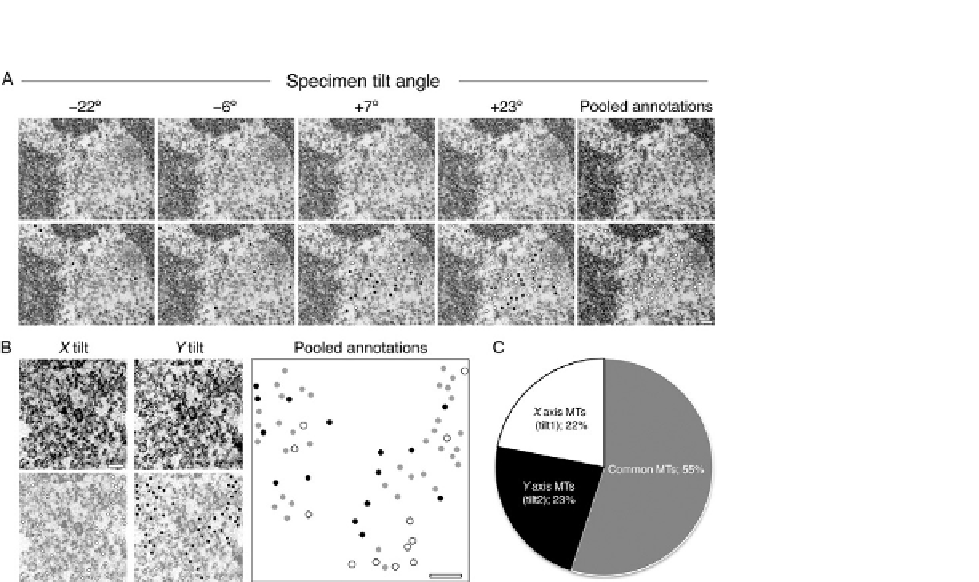
FIGURE 20.5
Sample tilting is necessary to achieve full coverage of microtubules in orthogonal sections.
(A) Example electron micrographs taken from a 45
to þ45
tilt series of a K-fiber.
Observable microtubules are marked with dots (bottom row). Black dots represent
microtubules that are unique to that tilt frame. White dots represent the accumulating
microtubules identified in previous tilt frames. The total number of microtubule annotations
were pooled together onto one frame (far right) giving a fair overview of the whole K-fiber.
Scale bar 100 nm. (B and C) A dual tilt series of one K-fiber was carried out. (B)
Representative electron micrographs taken from the central region of both X and Y tilts
(A-top). All microtubules observed in each tilt series were annotated (bottom; X axis in white,
Y axis in black). The sum of microtubules from both tilts were pooled together on to a single
blank image, any microtubules that were common to both tilts were marked gray. Scale bar
100 nm. (C) A pie chart showing the percentage of total microtubules that were unique to
each tilt and also the common ones.
tool to study cellular processes. However, this technique is often overlooked as it is
considered too time-consuming and technically challenging.
Our CLEM protocol has been optimized for the study of mitotic spindles, where a
great amount of attention has been placed on the preservation of the ultrastructure of
microtubules and other spindle components. Our osmolality tests have shown that
fixative solution osmolality must be as close to physiological conditions as possible.
But further improvements could potentially be achieved during sample dehydration
steps, at which point cell shrinkage can occur, as well as partial cytosolic washout.