Biology Reference
In-Depth Information
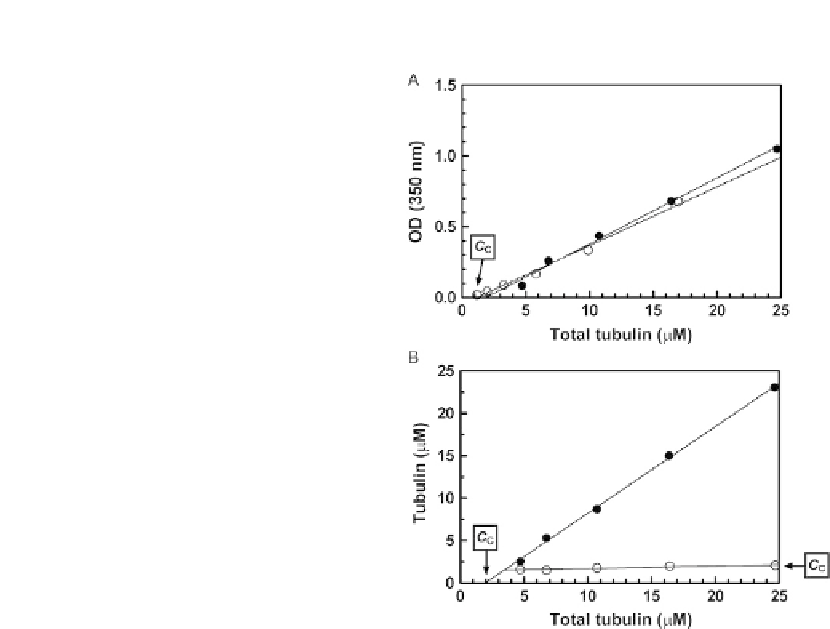
FIGURE 14.1
Critical concentration for polymerization determined by OD and by pelleting. Polymerization in
Pipes-Mg-TMAO was monitored as a function of total tubulin concentration by OD
measurements as well as by a pelleting assay. (A) Polymerization monitored by OD. The filled
circles represent reactions in which unpolymerized tubulin at the indicated concentrations
was allowed to polymerize and OD recorded. The open symbols represent an experiment in
which tubulinwas initially polymerized at 1.7 mg/ml (17
M) and then sequentially dilutedwith
prewarmed buffer to the indicated concentrations. At each point, the sample was allowed
to equilibrate for
m
8 min, OD recorded, and additional buffer added. Both data sets indicate a
C
C
of 1-1.2
M (see arrow). (B) Polymerization determined by a pelleting assay. Samples were
removed at steady state from the reactions indicated by the solid symbols in panel (A), and
centrifuged for 5 min at room temperature in a Beckman Airfuge at 30 psi (150,000
m
g).
Protein contents were determined for the supernatant and the pellet, and plotted as
concentration in the sample. The filled symbols are the concentrations of polymer pelleted and
indicate a critical concentration of about 2
M. The open symbols are the concentration of
unpolymerized protein in the supernatant and indicate a C
C
of about 1.5
m
M. The low slope of
this line shows that essentially all of the tubulin was polymerization competent.
m
in
Fig. 14.1
for tubulin polymerization promoted by the natural organic osmolyte tri-
methylamine oxide (TMAO) (
Sackett, 1997
), see
Section 1.4
.
It is worth the time to determine the critical concentration of tubulin in the system
that will be used in the assay. This can be done by plotting the steady-state OD versus
C
T
, as just described, or by measuring the extent of assembly by OD followed by