Biology Reference
In-Depth Information
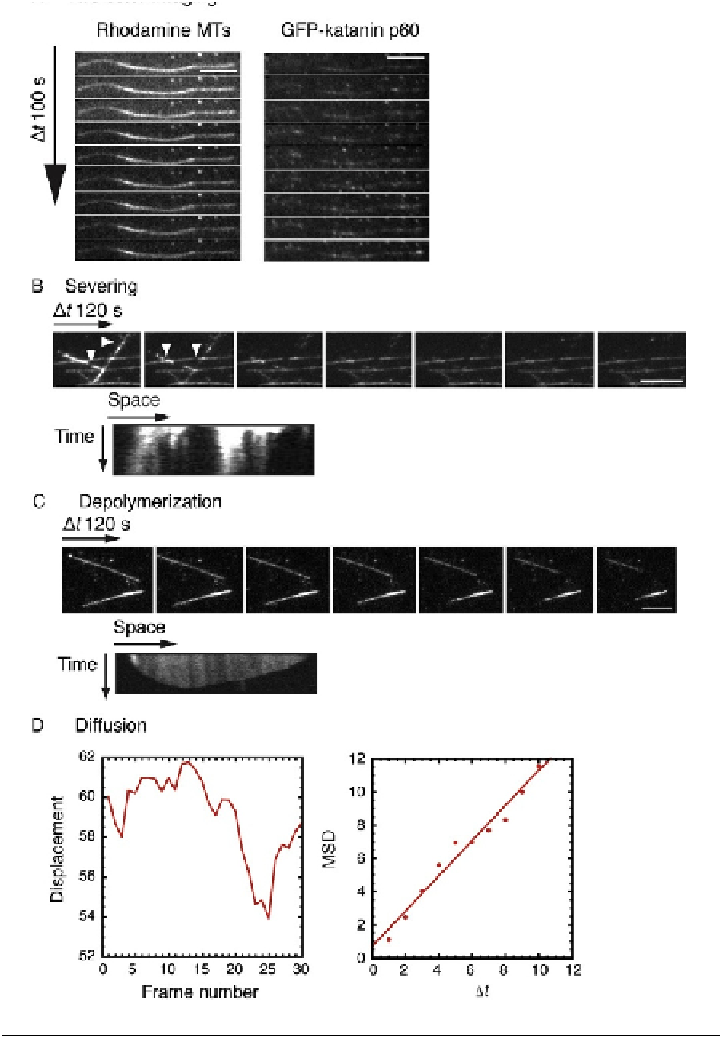
FIGURE 13.4
Visualizing severing and depolymerization. (A) Two-color time series showing severing and
depolymerization of microtubules (left) and binding of katanin (right). (B) Time series of
katanin-severing microtubules. A severing event is when a gap appears in the microtubule
(white arrows). The kymograph shows the microtubule over the course of the movie, where
the x-axis is space and the y-axis is time. (C) Time series of katanin-depolymerizing
microtubules. The kymograph shows an example of depolymerization. All scale bars are
5 mm. (D) Plot of the displacement of a single katanin complex over 30 frames (left) and a
mean squared displacement (MSD) over shifted time, Dt (right).