Biology Reference
In-Depth Information
A
T
τ
Δ
x
c
=vT
d
2
d
1
Δ
x
f
Time (s)
B
20
10
0
−
10
0.4
0.0
−
0.4
0
2
4
6
8
10
12
Time (s)
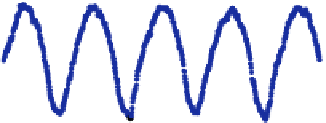
FIGURE 6.9
Representative data traces by magnetic tweezers showing force and bead displacement
as a function of time. (A) Schematic of a typical creep response curve under a rectangular
force pulse. (B) A typical oscillatory response curve under modulated force.
Adapted from
Yang et al. (2012)
and
Lin and Valentine (2012b)
. Reproduced by permission of The Royal Society
of Chemistry and the American Institute of Physics, Copyright 2012.
and the end as the time at which the force settles to the commanded value. The “flow
regime” follows and ends when the force is reduced at time
t
T
. This can be re-
peated many times as a function of applied force. After identifying these regimes,
the following parameters are calculated:
d
1
is the distance the bead travels in the elas-
tic regime and
t
is the total time of the relaxation regime. When the magnets are
retracted, we identify an elastic recovery regime with jump back distance
d
2
.The
total displacement of the bead due to creep is measured as
D
¼
x
c
¼
vT
. The total dis-
placement of the bead after the force pulse is measured as
D
x
f
. Network stiffness is
determined by dividing the applied force
F
by
d
1
.