Biomedical Engineering Reference
In-Depth Information
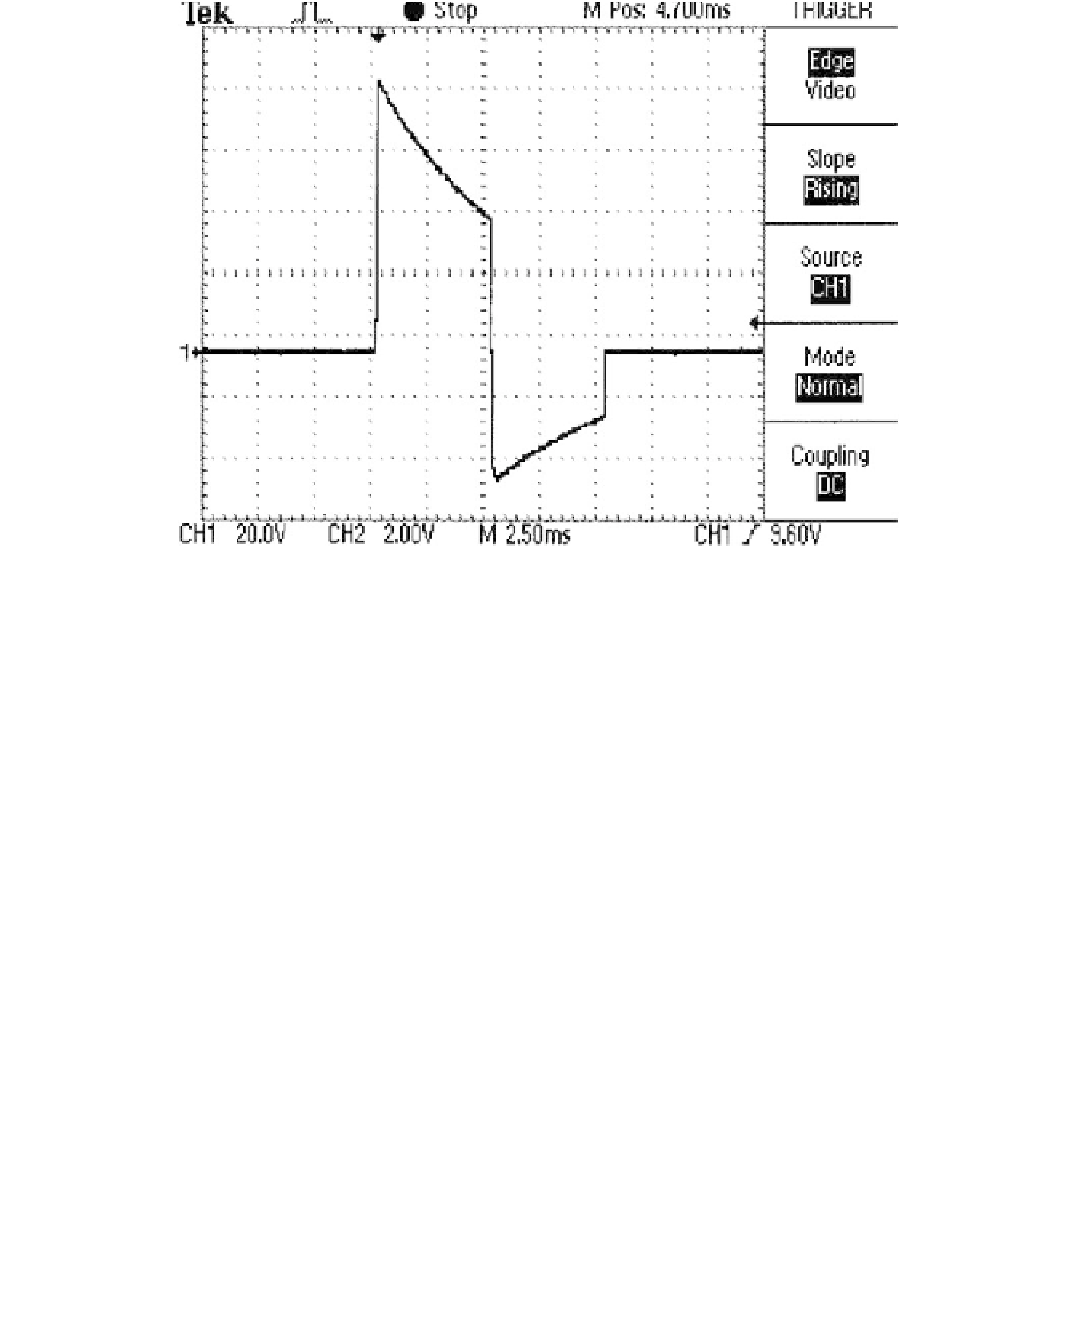
Figure 8.41
Oscilloscope display of the voltage across a 50-Ω resistive load connected to the output of the H-bridge. The capacitor bank
was charged to approximately 90 V, and the circuit was made to generate a biphasic pulse with 5-ms-duration phases. The interphase inter-
val was chosen arbitrarily to be 50 µs.
an independent,
resistor across the bridge output is
used to maintain stability of the bridge's switches by establishing a common-mode hori-
zon whenever there is no de
fl
floating solid-state relay. A 100 k
Ω
brillation load connected to the output. It must be noted that
the photovoltaic isolators are not used as part of the applied-part isolation (safety) barrier.
Rather, they are used to simplify the driving circuitry for the H-bridge, since they act as
fl
fi
floating sources that establish a potential di
ff
erence only across the gate-emitter of their
related IGBT.
Figure 8.41 presents the oscilloscope display of the voltage across a 50-
Ω
resistive
load connected to the output of the H-bridge. For this
figure the capacitor bank was
charged to approximately 90 V, and the circuit was made to generate a biphasic pulse with
5-ms-duration phases. The interphase interval was arbitrarily chosen to be 50
fi
µ
s.
Isolation Ampli
fi
ers
As shown in Figure 8.42, an AD210AN isolation ampli
er (IC29) is used to sample the
voltage across the capacitor bank (using the voltage divider formed by resistors R84 and
R86 on the high-voltage capacitor charging circuit). A second AD210AN (IC35) samples
the instantaneous capacitor charge-discharge current by sampling the voltage developed
across the 0.5-
fi
current-measurement resistor (R90 on the high-voltage capacitor charg-
ing circuit). The output of the AD210s is made available through BNC connectors to make
it possible to sample and analyze the charge-discharge waveforms with an oscilloscope or
other data acquisition system.
Ω

Search WWH ::

Custom Search