Biomedical Engineering Reference
In-Depth Information
R20
C11
0.1uF
5.6M
1%
+5Viso
I
R21
11K
1%
R22
1
1%
+5Viso
Q2
2N3906
Current Injection
Electrode 1
+
C12
10uF
C13
.01uF
R23
22K
1%
IC3
TL081
J1
1
I
I
7
1
JP1
JUMPER
Inj1
3
2
+
-
6
C1
4
4 5
VTOI_1
R24
22K
1%
.05uF
+
C15
C16
.01uF
-5Viso
Q3
2N3904
10uF
J2
1
I
I
R27
Inj2
R25
11K
1%
Current Injection
Electrode 2
R26
1K
1%
1
1%
R28
10M
1%
I
I
-5Viso
IC1A
TL082
8
R29
100K
3
2
+
-
50KHZ
1
JP2
JUMPER
C1
7
4
R30
10K
.047uF
I
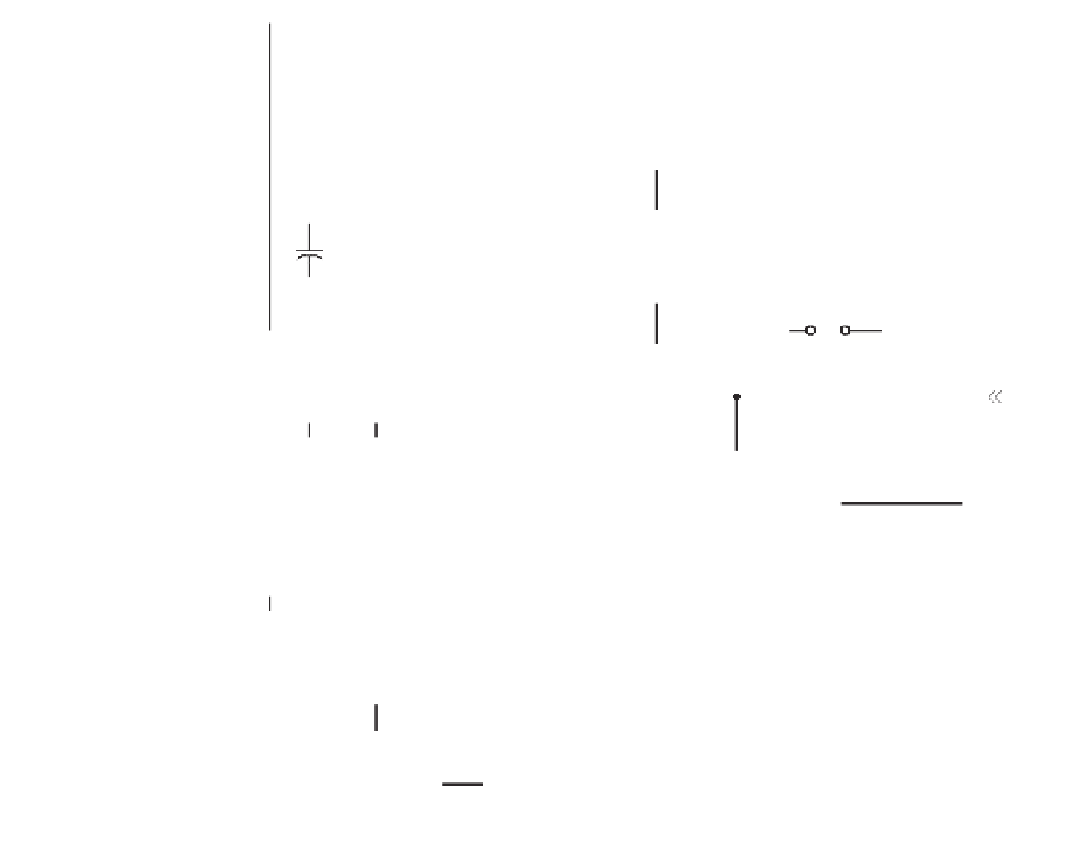
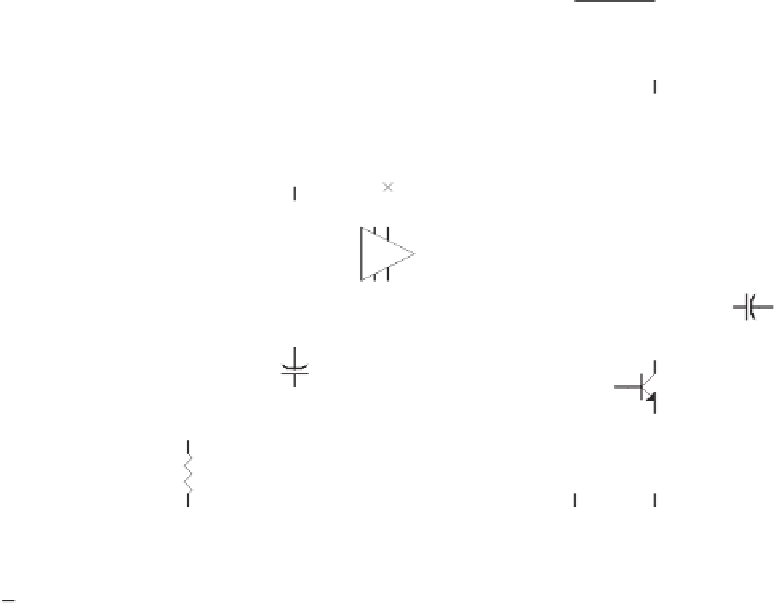
Figure 8.17
Voltage-controlled current source of the general-purpose impedance plethysmograph. The output of the oscillator is buffered
by IC1A, scaled via potentiometer R30 and ac-coupled to modulate the current through Q3. IC3, Q2, and Q3 is a class B amplifier that is
made to operate as a constant-current source.
Impedance measurements obtained through the conductance catheter cannot be used
directly, since important intrinsic errors are generated by the nonhomogeneous distribution
of the current lines within the measured volume as well as because of leakage currents
through the heart muscle and extracardiac tissues. The
ects the linear rela-
tionship between conductance and volume, while the latter adds a “phantom” parallel vol-
ume. Special calibration and signal processing techniques are usually applied to scale and
linearize the impedance measurements against true ventricular volume.
Conductance catheters are often used by researchers and physicians to generate a graph
of the left-ventricular pressure-volume relationship. This relationship, known as a
PV
loop
, gives important information on the type of cardiomyopathy and possible treatments.
Pressure is measured using a miniature sensor that is part of the conductance catheter. PV
diagrams clearly distinguish the four phases of the cardiac cycle (isovolumetric contraction,
fi
rst error a
ff


Search WWH ::

Custom Search