Biomedical Engineering Reference
In-Depth Information
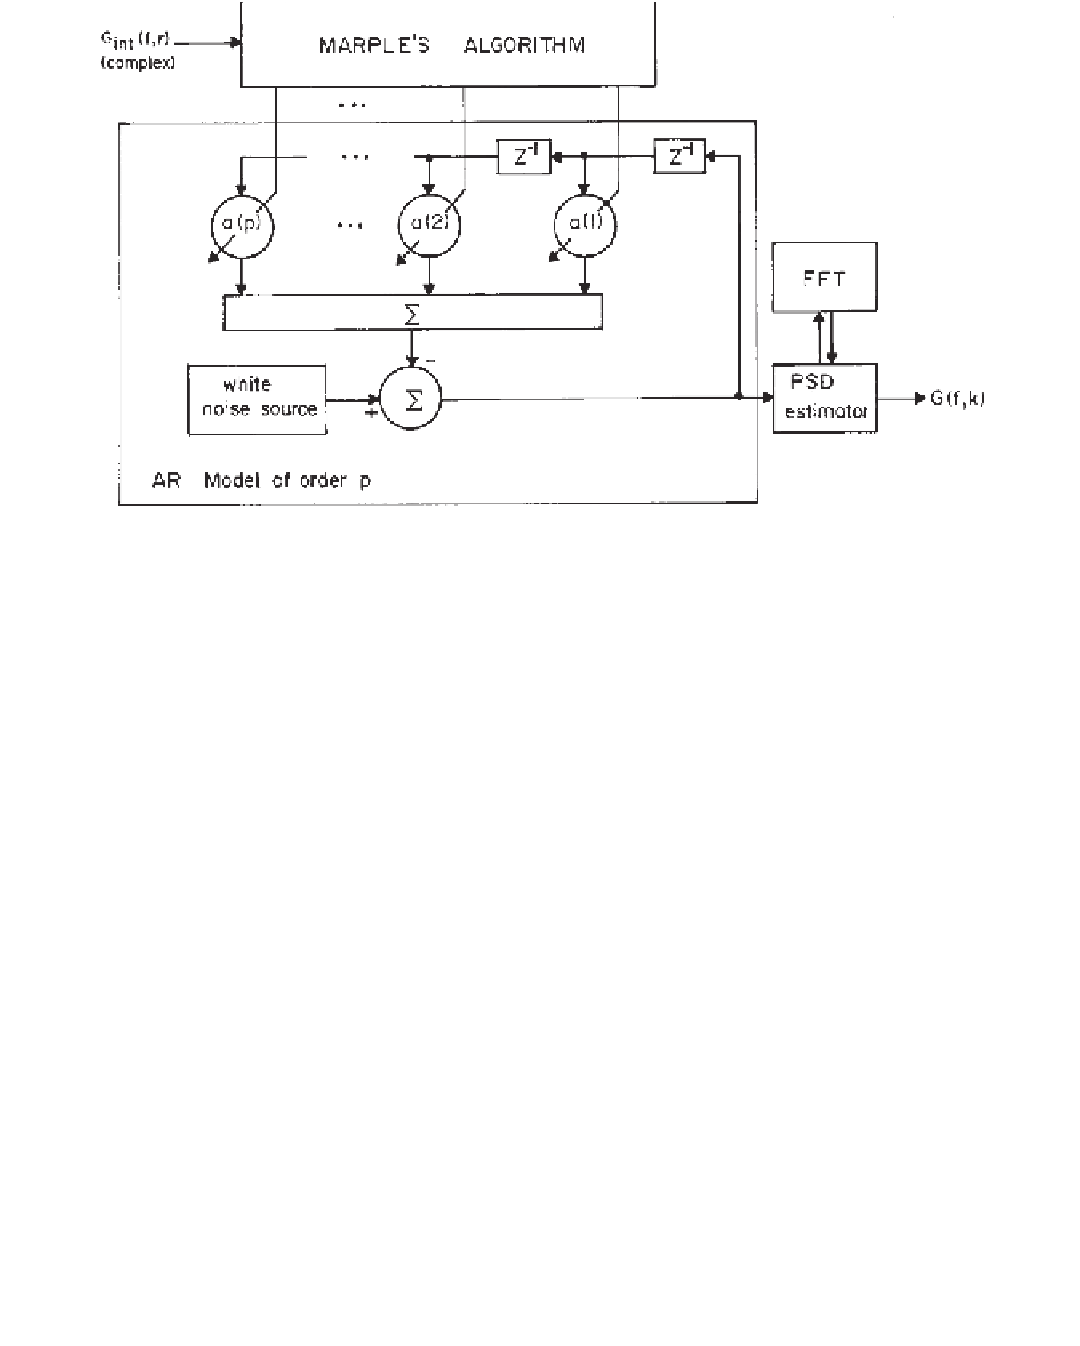
Figure 5.18
In one implementation of a parametric high-resolution spectral estimator, the coecients
a
0
,
a
1
,
...
,
a
p
of an AR filter are
determined from input data through Marple's algorithm. The transfer function of the filter is then evaluated eciently by the FFT, resulting
in a high-resolution estimate of the input data's PSD.
You may also notice that Marple's estimate is “peaky” even for the smooth continuous
spectral components at the far right and far left of the PSD. The reason for this is that a
purely autoregressive
filter will generate a spectrum based on pure resonances, and only
through use of a moving average could these resonances be damped to produce a perfectly
smooth spectrum in regions where this is necessary. Although this limitation of AR-based
estimators would lead to errors in the actual amplitudes of the PSD components, it is very
well suited for high-resolution detection of periodicities in the signal.
A price must be paid for the increase in resolution, and just as you might suspect, the
computational burden of these high-resolution methods far exceeds that for a simple FFT. In
addition, like the selection of an appropriate window for the classical estimators, the rules for
selecting an appropriate model, parameter estimation method, and model order are essen-
tially in
fi
fl
exible.
Implementing Spectral Analysis Algorithms
Program SPECTRUM.BAS at the Wiley ftp site for this topic demonstrates implemen-
tation of the spectral estimation methods discussed above. The program was written in
QuickBasic 4.5, but should run with little trouble under any other Basic compiler on
any PC. The FFT, as well as Welch's averaged periodogram and the AR spectral esti-
mation routines, are based on the Fortran programs that accompany Marple's topic.
However, Basic does not support complex-number arithmetic, so explicit operations
have been used in which variable names with the su
x “r” represent the real portion of
that variable, and those with the su
x “i” represent the imaginary portion of the same.
The ftp site also includes a version of this program (LPT8SPEC8.BAS) that acquires
evenly sampled data through the Universal Sensor Interface described above and then
displays the spectrum estimated via the zero-padded FFT, an averaged-periodogram

Search WWH ::

Custom Search