Biomedical Engineering Reference
In-Depth Information
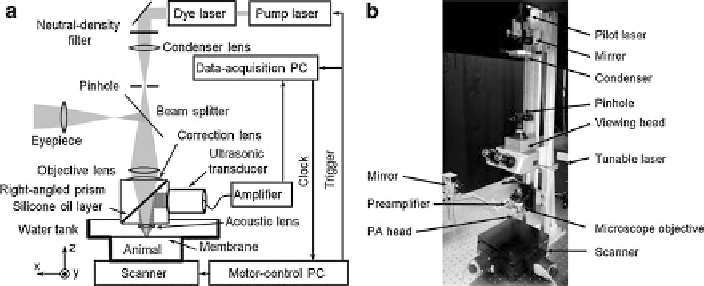
Fig. 2.2
(
a
) Schematic and (
b
) photograph of the optical-resolution photoacoustic microscopy
system
acoustic axis from the optical axis by 90
ı
. Thus, an ultrasonic transducer (V2022-
BC, Olympus NDT) can be attached to the vertical side of the bottom prism for
ultrasonic detection without blocking the optical irradiation, while still maintaining
the coaxial alignment. An acoustic lens (geometrical radius of curvature: 5.2 mm;
diameter: 6.35 mm) is attached to the bottom of the cube to be confocal with the
optical irradiation. This acoustic lens has an NA of 0.46 in water and gives an
acoustic focal diameter of 27 m. To expose the imaging site, a window is opened at
the bottom of the water tank and sealed with ultrasonically and optically transparent
polyethylene membrane. Ultrasonic gel (Clear Image, SonoTech) is applied between
the polyethylene membrane and the object for acoustic coupling. A transmission-
mode optical microscope is integrated into our system by adding a white-light
illumination to the object and an optical beam splitter between the pinhole and
the microscope objective. Utilizing the reverse optical path of the OR-PAM, the
imaging region can be viewed under the eyepiece. This addition helps quickly target
the region of interest (ROI).
The photoacoustic signal detected by the ultrasonic transducer is amplified by
two cascaded amplifiers (ZFL 500LN, Mini-Circuits) and then digitized by a 14-bit
data acquisition (DAQ) board (CompuScope 14200, Gage Applied Sciences) at a
sampling rate of 200 MS/s. Raster scanning is controlled by a separate personal
computer, which triggers both the DAQ board and the pump laser. The trigger
signal is synchronized with the clock-out signal from the DAQ board. The 2-D raster
scanning is implemented by translating the water tank and the animal together along
the horizontal (x-y) plane. The fast axis of the scanner is defined as the direction
of the cross-sectional scan (B-scan). Volumetric OR-PAM image is obtained by
combining a sequence of B-scan images acquired by translating the slow axis and
can be viewed in direct three-dimensional (3-D) renderings or in 2-D maximum-
amplitude projection (MAP) images.
Search WWH ::

Custom Search