Biomedical Engineering Reference
In-Depth Information
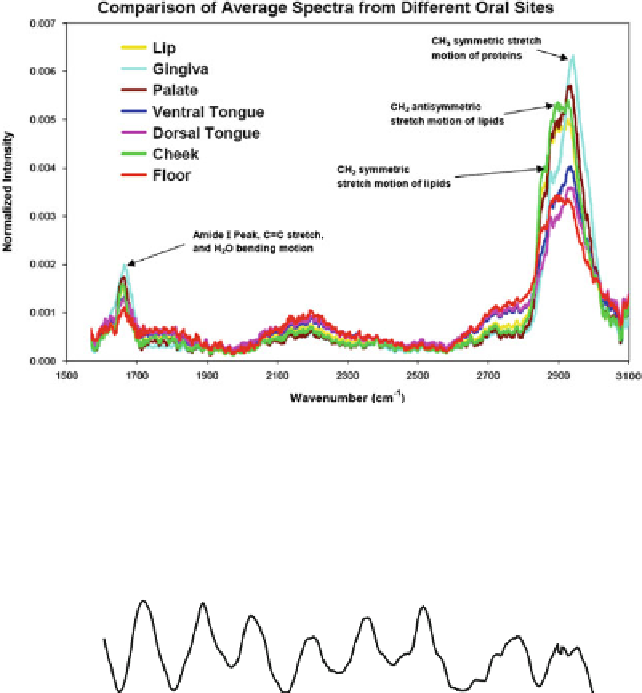
Fig. 1.24
Average Raman spectra of
in vivo
oral mucosa of different anatomic oral sites. All
spectra were measured within 1 s integration time (Adapted from Guze et al. [
71
], with permission)
Normal (n=55)
Dysplasia (n=21)
4
3
2
1
0
800
1000
1200
1400
1600
1800
Fig. 1.25
Averaged Raman spectra of
ex vivo
normal and cancerous gastric tissue (Adapted from
Teh et al. [
73
], with permission)
1,210, 1,265, 1,335, 1,450, 1,655, and 1;745 cm
1
. The authors found that the
peak ratios between dysplasia and normal could be used for diagnosis. Analysis
on the ratio of 875-1;450 cm
1
and 1;208-1;655 cm
1
provided a sensitivity and
specificity over 90% based on leave-one-out cross validation. Diagnosis based on
the intensity and spectral shape could reach 95.2% of sensitivity and 90.8% of
specificity based on leave-one-out cross validation of PCA-LDA analysis. Hu et al.
[
75
] studied the human gastric mucosa tissue using a commercial confocal Raman
microspectroscopy with an argon laser at 514.5 nm. They studied 13 normal and
19 malignant tissue samples from 32 patients. Each spectrum was acquired with an
integration time of 30-120 s. The fluorescence background was removed based on
wavelet decomposition. The authors found that the most intense Raman peak for
normal gastric mucosa is located at 1;452 cm
1
or 1;587 cm
1
and for malignant


Search WWH ::

Custom Search