Biomedical Engineering Reference
In-Depth Information
a
b
505
Different tooth regions
No caries (1)
Initial caries (2)
Advanced caries (3)
5000
4000
466
582
3000
540
632
2000
1000
0
400
500
600
700
800
400
500
600
Wavelength / nm
Wavelength / nm
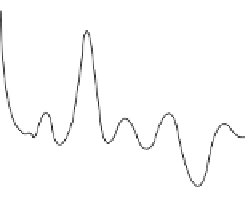
Fig. 9.12
(
a
) Fluorescence excitation spectrum of a strong fluorescent carious region. Fluores-
cence was detected at 700 nm. (
b
) Emission spectra at different region with excitation wavelength
of 400 nm [
53
]
180
160
140
120
100
Water
80
60
40
enamel
20
0
600
800 1000 1200 1400 1600 1800 2000 2200 2400 2600
Wavelength (nm)
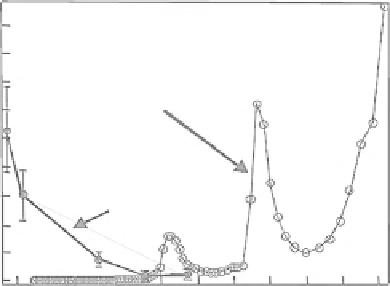
Fig. 9.13
The attenuation coefficient of dental enamel [
54
]
shown in Fig.
9.13
, the magnitude of scattering decreases exponentially at longer
wavelengths and reaches minimum around 1,300 nm [
54
]. At longer wavelengths
past 1,550 nm, the attenuation coefficient is not expected to decrease further due to
the increasing absorption coefficient of water which is
12 % by volume in dental
enamel. Therefore, a swept-source laser with a central wavelength of 1,325 nm and
a bandwidth of 100 nm is used in this multimodal imaging system.
9.4.3
Detector
Because it is an area imaging system, an area detector, namely, CCD or CMOS, is
needed. Ideally, a cooled CCD is the best choice for fluorescence imaging because


Search WWH ::

Custom Search