Biomedical Engineering Reference
In-Depth Information
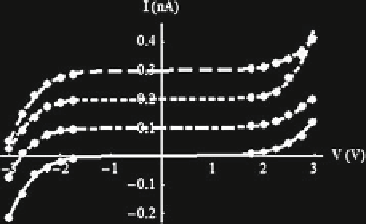
Fig. 1.39
The electric
signature of the four bases of
the DNA
G
C
T
A
field-emitted electrons, with heights . The work functions of the four DNA bases
are then determined from
p
2m
0
e
„
4L
3
3=2
;
b
D
(1.37)
where m
0
is the free electron mass and L is the distance between the STM tip
and the sample. The fitting I
V curves are illustrated in Fig.
1.39
with solid
line for A, dashed-dotted line for T, dotted line for C, and dashed line for G, the
points on all the curves representing experimental data taken from Fig.
1.3
aof(
Xu
et al. 2007
). The characteristics for G, C, and T have been raised with 0.3, 0.2, and
0.1 nA, respectively, to render them easily readable. As can be seen from Fig.
1.39
,
the I
V characteristics are not symmetric with respect to the origin. The forward
polarization data were fitted with a series resistance value of 500 for A, 1,000
for T, 1,000 for C, and 454 for G, and the corresponding a parameters in (
1.36
)
have values of 0.34, 0.27, 5.51, and 0:35 nS V
1
. On the contrary, the fitting series
resistances for the backward polarization data are 555 for A, 100 for T, 500
for C, and 666 for G, the corresponding a parameters being 0.95, 1.35, 1.15,
and0.75nS/V.Using(
1.37
), the work functions of the bases are found from the b
parameters of the fit. These have, again, different values for positive and negative
polarizations. For positive voltages, they are 9.7 V for A, 9.3 V for T, 16 V for C,
and 10.1 V for G, while for negative voltages, the corresponding values are 11.2 V
for A, 12.9 V for T, 12.2 V for C, and 10 V for G.
The different fitting parameters for the two polarizations are caused by specific
base interactions with the substrate. The average work functions obtained from
data at positive and negative polarizations are 1.74 eV for A, 1.81 eV for T, 2.12 eV
for C, and 1.7 eV for G, for an estimated L value of 0.66 nm. It is interesting to
note from Fig.
1.39
that all bases behave as semiconductors, displaying a Zenner
diode-like behavior.
The conduction of DNA is an active research issue. For example, short dsDNA
molecules formed from 13 base pairs of poly(dA)-poly(dT) were measured on a
gold substrate, with gold nanoparticles with diameters of 10 nm as electrodes (
Qian
et al. 2009
). The conduction type detected with the STM for a single dsDNA
molecule was discovered to be semiconducting. Double-stranded DNA molecules
were bonded with thiol to the gold film and are terminated with a single gold
nanoparticle as electrode for STM tip measurements (see Fig.
1.40
).
Search WWH ::

Custom Search