Biomedical Engineering Reference
In-Depth Information
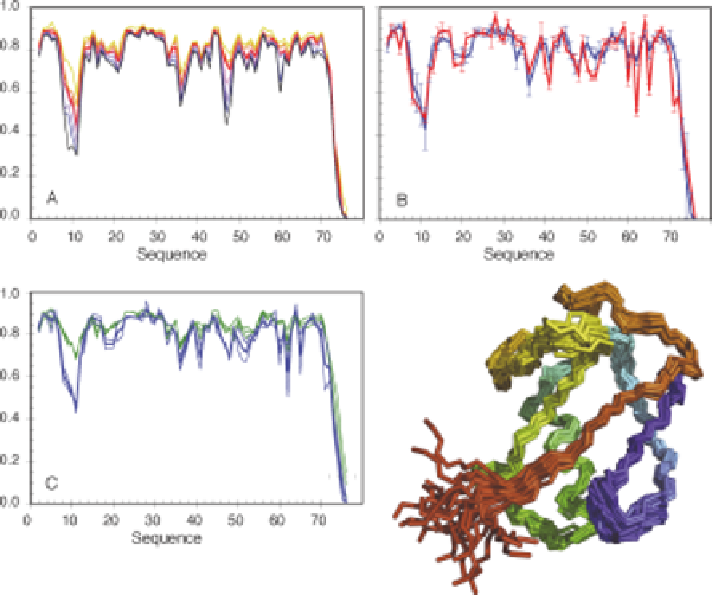
Figure 8.3
N-H
N
S
2
order parameters for the protein ubiquitin. (A) S
2
values
derived from free-energy weighted ensembles derived from AMD
simulations performed at increasing levels of acceleration (black
represents the highest level and orange the lowest). The optimal level
of acceleration, as determined from the x
2
with respect to the
experimental values is represented by the red line. (B) Comparison of
AMD- (blue) and GAF- (red) derived S
2
values. (C) Comparison of fast
motional S
2
values (the green lines show two independent experimental
data sets measured 10 years apart, in different groups, and extracted
using different analytical procedures, the blue line shows the mean of the
two values) and slow motional S
2
values (the two curves in (B) are
shown, and their mean). Bottom right: representative ensemble of the
protein ubiquitin, derived from AMD calculations. Adapted from ref. 84
with permission. # American Chemical Society, 2011.
surface of the protein. MD has been used for many decades to simulate
motions on timescales that can be compared to measured experimental NMR
data.
76
The correspondence of accessible timescales with the motions probed
by spin relaxation has fostered widespread comparison of NMR with MD for
the understanding of fast (picosecond-nanosecond) motions in globular
proteins. It has also been shown that increasing the length of an MD
trajectory of ubiquitin increased the reproduction of experimental RDCs.
59
Trajectories
are
still
normally
restricted
to
timescales
of
hundreds
of