Biomedical Engineering Reference
In-Depth Information
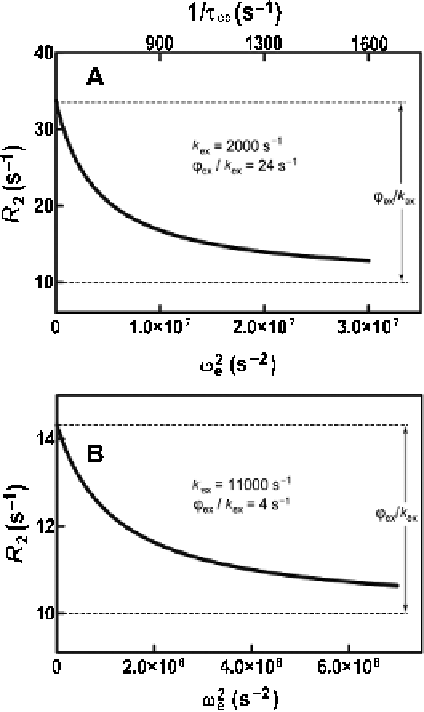
Figure 7.1
Simulated relaxation dispersion curves. In (A) a CPMG dispersion curve
is shown for an exchange process occurring with k
ex
5 2000 s
21
, R
2
5 10
s
21
, p
A
p
B
5 0.0475, Dv 5 1000 s
21
. The amplitude of the effect of
conformational exchange on R
2
is shown by the dashed lines. The
upper y-axis shows the CPMG pulsing rate in the more familiar
1/t
cp
units, in values experimentally accessible for
15
N-CPMG
experiments. The bottom y-axis shows the CPMG repetition rate
as
(v
e
~
p
=
t
cp
).
38
These
CPMG-effective fields can be compared with those achievable in
the R
1r
experiment in panel (B). In (B) the curve is simulated with
exchange parameters identical to (A) with the exception that k
ex
5
11000 s
21
.
the
corresponding
effective
field
12
by the duty-cycle properties of the rf amplifier as well as sample heating from
power deposition into the NMR tube. Overall, these factors limit CPMG
experiments to the study of exchange processes with k
ex
# 10
4
s
21
. In the case
of faster motions, these limitations prevent sufficient sampling of the necessary