Biomedical Engineering Reference
In-Depth Information
Figure 4.1
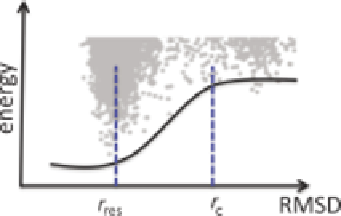
NMR Restraints in structure calculation. Shown is a typical restraint-energy
landscape as scatter plot of restraint energy vs. distance (RMSD) from native
structure. The lowest energy rim line (LERL
26
)isshownasblackcurve.The
LERL is flat for distances smaller than r
res
, which limits the resolution that
can be gained with the restraints. For distances larger than r
c
the restraints
are not instructive (see text). For intermediate distances the LERL has a
significant gradient guiding the simulation towards the native structure. In
this area the restraints have the most impact on the structure calculation.
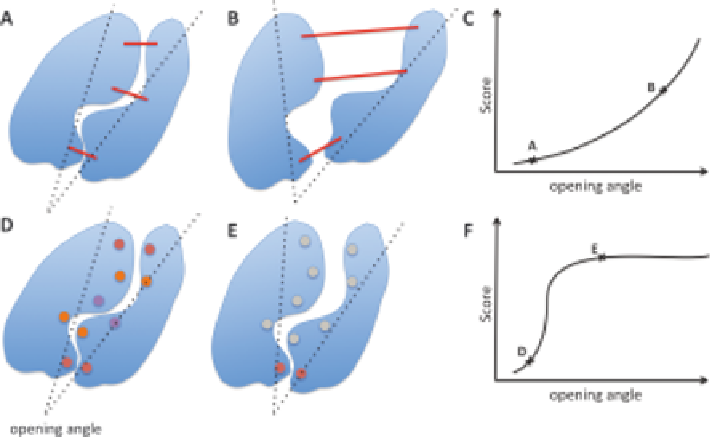
Figure 4.2
Illustration of instructive (A-C) and non-instructive (D-F) restraints.Inthis
illustration, the same closed conformation of the two protein domains (blue
shapes) is favoured by both types of experimental information. In (A-C) the
experimental information yields distance restraints (red lines), as e.g.,NOE
data, whereas in (D-F) an accurate local environment of interface sites
(circles) is required to explain the experimental data. For the visualisation of
the latter restraint, we show opposing circles in matching colours if their
local environment is correct and display them in grey if their local
environment is not correct. Thus, these circles behave similar to chemical-
shift-derived restraints. The opening angle of the two domains is well defined
by the experimental restraints. However, the restraints behave differently in
the approach to the correct structure. Distance restraints (A-C) yield a
gradient for large opening angles, whereas a contact-score (D-F) has a
neutral gradient, as soon as contact sites are out of range (grey in E).