Cryptography Reference
In-Depth Information
25
20
15
10
5
0
Memory address space
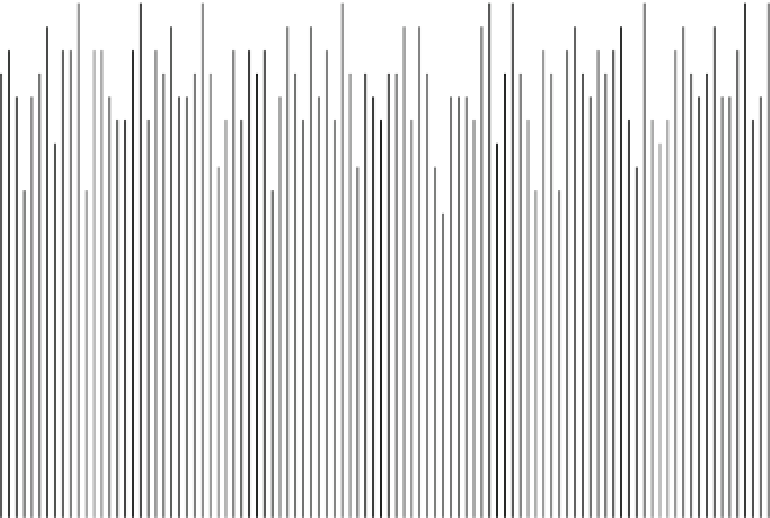
Fig. 16.5
Distribution of the quantity of the injected faults as a function of the position in the
address space. The dashed line indicates the expected average value in the hypothesis they are
uniformly spread
encountered 1,864 faulty
load
s while running the program; thus we are expecting
an average of 18.64 faults per zone if the faults fall uniformly over the address space.
The dashed line in Fig.
16.5
indicates the expected number of faults occurring for
each zone, assuming a uniform distribution of the faults over the memory.
To confirm the uniform distribution of the faults over the whole address space,
we modeled the position hit by the fault as a random variable and we conducted a
Pearson
2
test to assess the goodness of fit. The results confirmed our hypothesis
with confidence over 99.99 %.
χ
16.3.5 Error Characterization and Effects
of Frequency Scaling
After fully characterizing the frequency and the occurrence conditions of the faults,
our natural target of the investigation becomes characterizing the kinds of errors
induced in the computations by the faults. By analyzing the data collected during
the last experiment, we were able to notice that all the faulty loads were affected
by flip-downs in the bit value loaded. Wanting to ascertain if only flip-downs were