Biomedical Engineering Reference
In-Depth Information
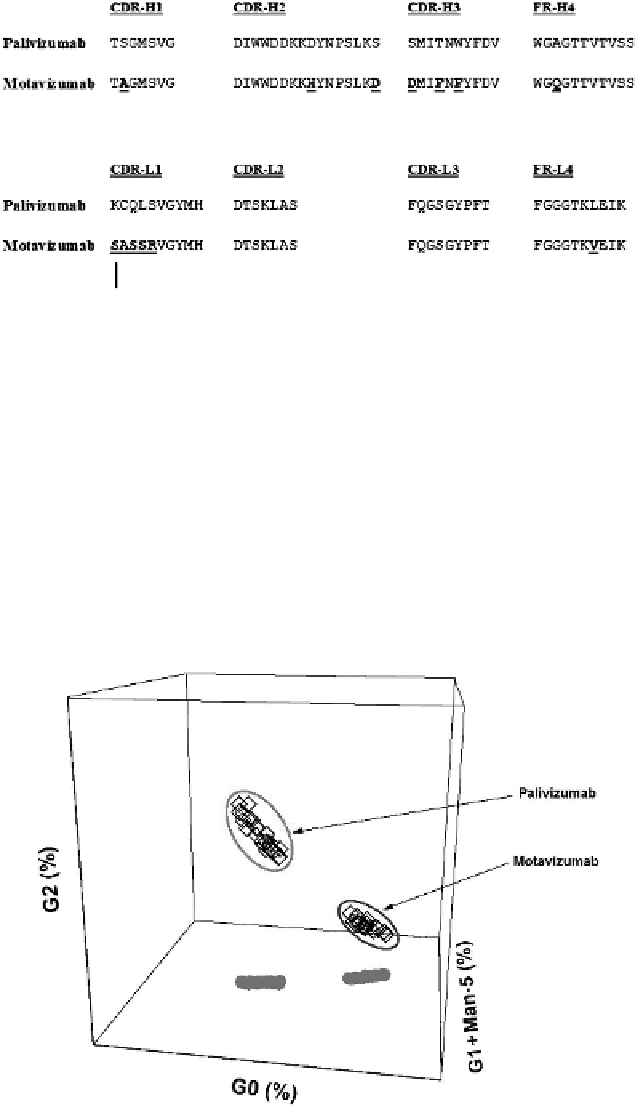
Figure
4.14.
Sequence differences between palivizumab and motavizumab.
In the oligosaccharide profile analysis (Dionexmethod) for palivizumab, the G1 and
Man-5 glycoforms are not resolved. Therefore, analysis of palivizumab glycoforms
included the three major observed peaks: G0, G2, and the combination G1/Man-5.
Although the oligosaccharide profile (2-AB method) used for motavizumab glycoform
analysis does resolve G1 and Man-5, for comparison to the palivizumab results the G1
and Man-5 values were combined for motavizumab. However, the 2-AB method
has shown that Man-5 accounts for a low level (average of 7%) of the total G1 and
Man-5 glycoforms, observed with the Dionex method, in palivizumab. The observed
proportions of glycoforms for various lots of palivizumab andmotavizumab are shown in
Fig. 4.15.
Studies were performed to determine differences in clearance rates among the
glycoforms of palivizumab and motavizumab. Product was isolated from human serum
Figure
4.15.
Observed glycoforms for motavizumab and palivizumab.