Biomedical Engineering Reference
In-Depth Information
Figure
2.7.
A design of experiments for two variables. This is a central composite circumferen-
tial design, a potential design for generation of a response surface plot. The numbers associated
with experimental points on the left are listed on the right in a table format indicating the
experimental conditions. The axial points (6-9) extend beyond (1.4-fold) the interaction points
(1-4), and this is indicated by a star in the table on the right.
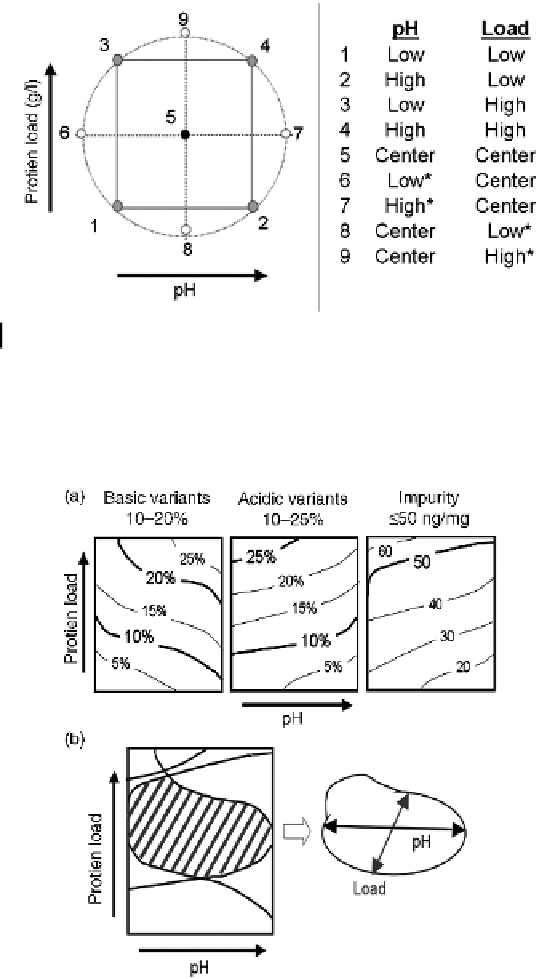
Figure
2.8.
Generation of an initial design space from three response contour plots. (a) The
anion exchange column step is intended to control charge variants and impurities. Hypothetical
contour plots modeled fromDOE studies for three important responses are shown. The limits of
these responses based on clinical experience and appropriate studies are indicated above each
plot. (b) An overlay of the acceptable areas of the three response plots can be used to define an
initial design space. As indicated above, the data used to construct the design space are
hypothetical and may not reflect the behavior of any product in real chromatography.