Biomedical Engineering Reference
In-Depth Information
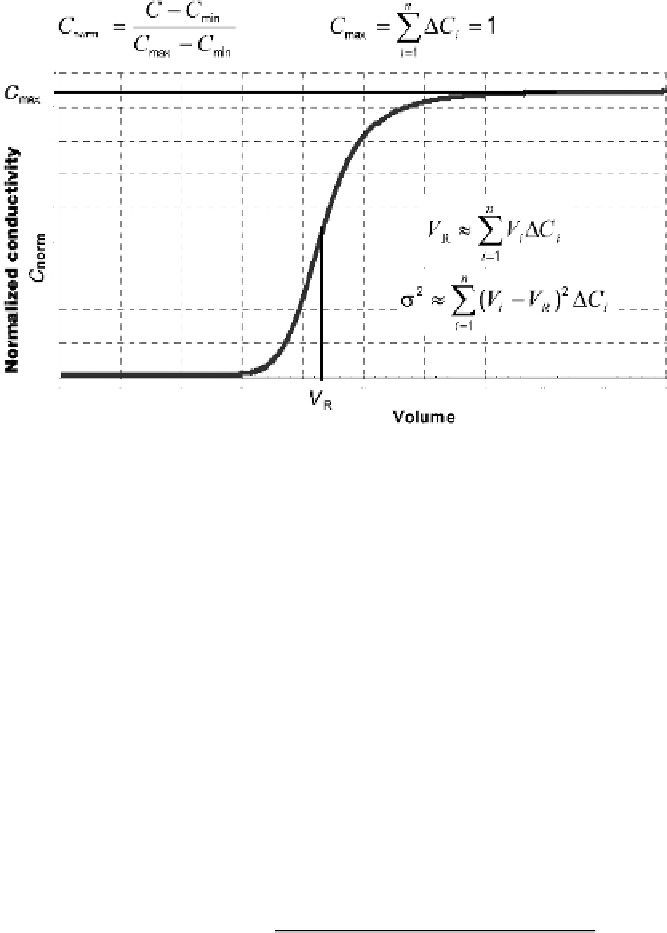
Figure
12.11.
Pictorial representation of a step-up transition on a solute concentration.
12.8.9 Overall Integrity Measure
The overall integrity measure is a weighted compilation of the results from the 10
individual transition analysis parameters. It allows a single parameter to be trended. To
normalize the dimensions of each parameter, the percentage of the average is used to
measure the offset of each parameter from its historical average. Each percentage of
average is weighted based on its individual sensitivity to detecting integrity failures.
The values are then summed and averaged together to yield the overall integrity
measure:
Parameter value
Historical average
%
of average
¼
100
P
½
weight
ð%
of average
100
%Þ
P
weight
Overall integrity
¼
Industrial examples as shown in Fig. 12.12 indicate the efficiency of transition analysis
against conventional techniques in detecting salient changes in column integrity and
performance. Lee et al. [36] have shown that the transition response curve after
12 column uses indicates a prepeak, a potential issue, early warning to operations,
whereas this is not easily discernable by inspecting UV elution profile. Similarly,
monitoring transition analysis measures over time (or use between packing cycles as