Biomedical Engineering Reference
In-Depth Information
(a)
Scaled estimate
Prob>|t|
Lower 95%
Upper 95%
Term
112.47703
40.388217
19.587127
24.58929
-27.27513
<.0001*
<.0001*
0.0032*
<.0001*
0.0004*
106.84443
23.915839
6.6933673
13.249103
-42.1284
118.10963
56.860596
32.480887
35.929477
-12.42186
Intercept
pH (growth)
DO%
Temperature (growth)
Feed-1 rate
(b)
200
150
100
50
0
-
-
-
+
+
+
Temperature
(growth)
pH (growth)
DO%
Feed-1 rate
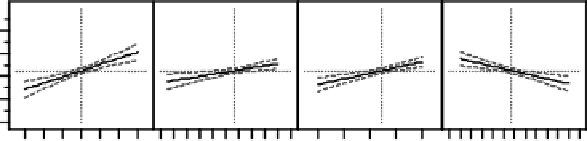
Figure
5.14.
Building a regression model for product quality 1 based on the acceptable
operating ranges. Note: Data have been normalized against the average small-scale model
performance at set point operating conditions. The symbols
and
þ
indicate the low and high
end of the operating range, respectively.
Next, a Monte Carlo simulation was performed in which the ranges of statistically
significant operating parameters were varied either triangular or uniformly within the
acceptable operating ranges (Fig. 5.15a). A triangular distribution for the Feed-1
parameter was selected to better represent the expected operational variation and control
tolerance around the target SP. Random noise was applied during the simulation that is
derived from the root mean square error associated with the model prediction. Fourth,
two-sided tolerance intervals were calculated based on the simulated performance data
(n
10,000) calculated to contain 99% of the population with 95% confidence
(Fig. 5.15b). The calculated performance output adhered to a normal distribution. For
generation of the initial model, all possible conditions (including interaction of multiple
operational parameters within the acceptable operating range) were considered with
equal weight or chance of occurrence. TheMonte Carlo simulation appropriately assigns
a higher probability to runs performed at SP of the operating ranges and lower probability
to runs performed at the edges of the ranges.
The PVAC calculated by Monte Carlo simulation are presented in Fig. 5.16.
They represent the tolerance interval describing 99% of the future data with 95%
confidence. As shown, the process performance at SP operating conditions falls well
within the PVAC. In addition, the observation that the worst and best case experiments
within normal operating conditions fall alsowithin the PVAC for product quality 1 further
demonstrates the robustness of the process. It should be pointed out that data from the
growth PC study that exceed PVAC were from experiments performed under extreme
conditions. These resulted in unacceptably high product quality 1 levels and thus, they are
expected to fall outside the proposed process validation acceptance criteria.
¼