Biomedical Engineering Reference
In-Depth Information
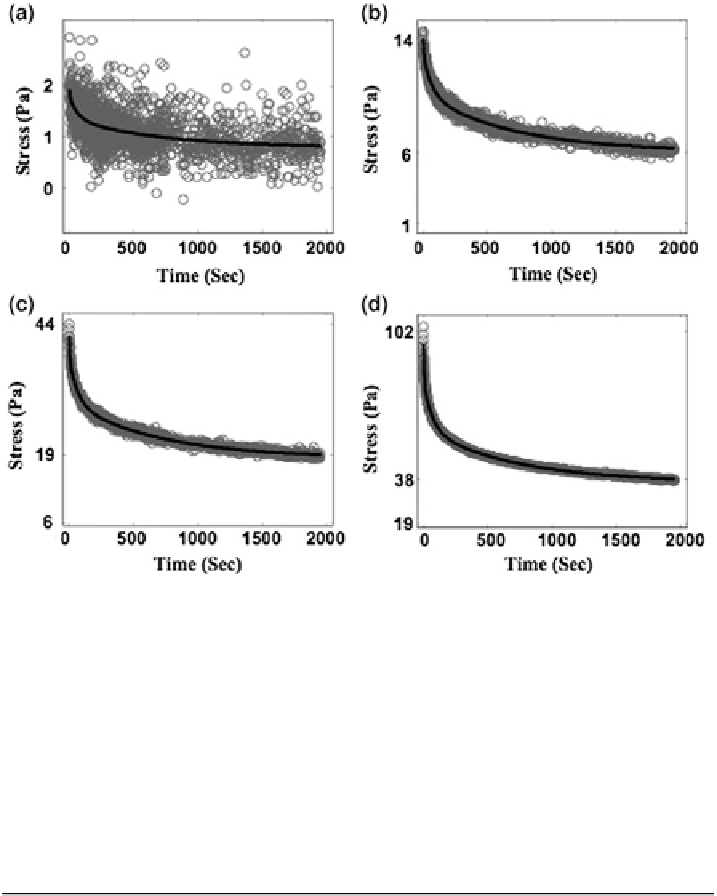
Fig. 9 Three time constant exponential fit of the Generalized Fung QLV model (black curves)to
the hold relaxation stress history data (gray circles). Optimum time constants were: 6.6, 61 and
611 s. a Initial strain of 0; b Initial strain of 0.0667; c Initial strain of 0.1333; d Initial strain of 0.2000
Table 3 Optimum time constants and associated slopes of piecewise linear A
i
functions for the
Generalized Fung QLV model. Data are presented at the final strain levels of the strain
increments
e
s
1
= 6.6 s (Pa)
s
2
= 61 s (Pa)
s
3
= 611 s (Pa)
0.0667
m
11
= 309
m
12
= 148
m
13
= 310
0.1333
m
21
= 878
m
22
= 1072
m
23
= 1191
0.2000
m
31
= 4662
m
32
= 1551
m
33
= 1948
0.2667
m
41
= 11491
m
42
= 4544
m
43
= 3767
Taking into account the plastic deformation, the ramp-loading stress histories
were computed in both models and plotted against the experimental recordings
(Fig.
11
c and e). The Adaptive QLV model has a reasonable fit to the ramp stress
(maximum deviation of 2.5 Pa.) while the Generalized Fung model slightly
overestimates the ramp stress (maximum deviation of 7 Pa.). The Adaptive QLV
model predicts a ramp-loading stress history with a greater upward curvature than
does the Generalized Fung QLV. This indicates that the nonlinearity has more
significant effect during the ramp loading.


Search WWH ::

Custom Search