Biomedical Engineering Reference
In-Depth Information
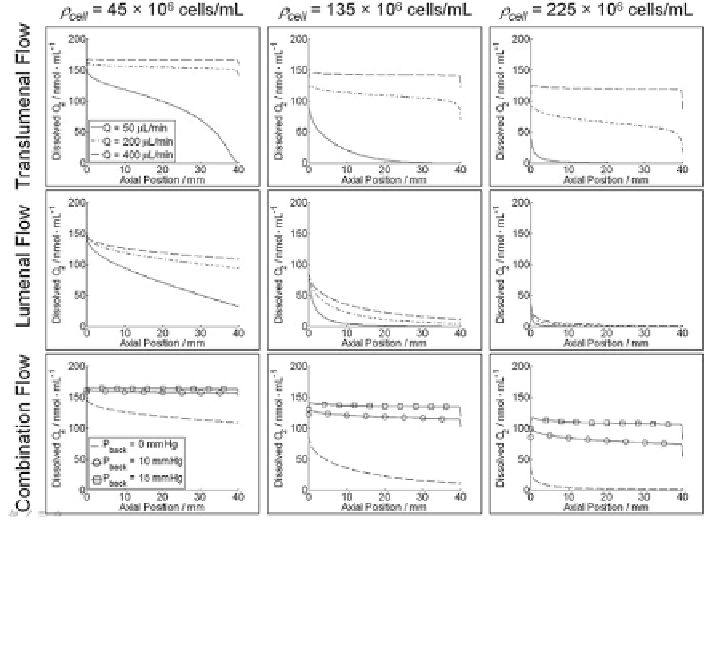
Fig. 4 Predicted DO concentration profiles along the ablumenal surface for the three different
bioreactor configurations and three different cell densities. The legend in the upper left graph
applies to each of the top six graphs (flow rates of 50, 200, and 400 lL/min, Pe
r
= 0.53, 2.13,
and 4.26, respectively, for translumenal flow). The legend in the bottom left graph applies to the
entire bottom row (back pressures of 0, 10, and 15 mmHg), for which the inlet axial flow rate is
constant at 400 lL/min. From [
23
]
rates result in a smaller differential from the inlet oxygen concentration (at z = 0)
for the translumenal flow and lumenal flow configurations. Cell density also
impacts the DO profile. As expected, as the cell density increases, the oxygen
concentration along the ablumenal edge decreases. Furthermore, the model
predicts that the v
r
profile is essentially constant for a given flow rate (results not
shown). Thus, increased volumetric flow will yield increased transmural flow;
however, there is no difference in v
r
between the lumenal inlet and outlet.
Figure
4
also reports the combination case of transmural and axial flow. Each
curve for this configuration represents varied applied back pressure (0, 10 and
15 mmHg) at a fixed flow rate of 400 lL/min (no applied back pressure provides
the same result as the lumenal flow configuration). Increasing the back pressure, in
turn, increases the amount of flow diverted from the lumenal outlet into transmural
flow. The combination case provides the benefit of having axial flow to increase
the oxygen concentration—and thus the diffusional driving force for DO into
the tissue—along the lumenal surface, while forcing additional oxygen through the
tissue convectively.
Search WWH ::

Custom Search