Biomedical Engineering Reference
In-Depth Information
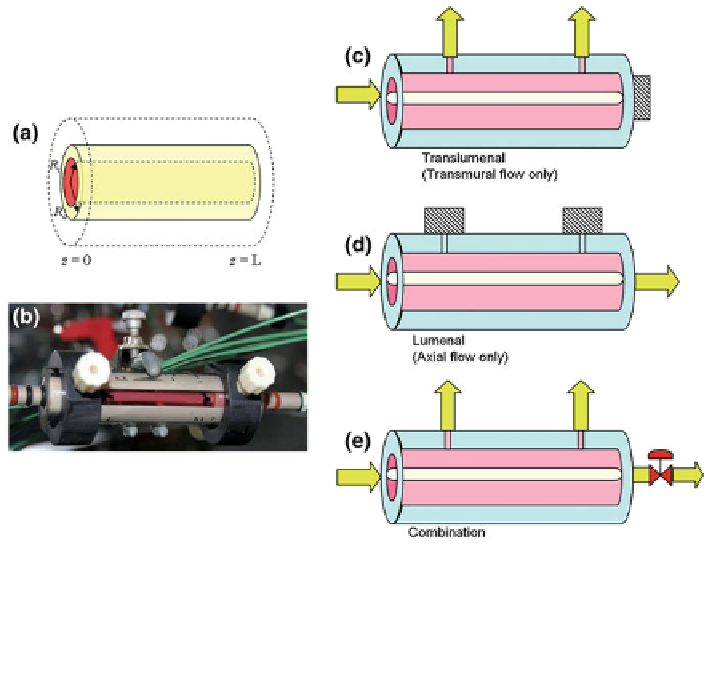
Fig. 3 Bioreactor configurations analyzed for steady flow. a Illustration of tissue dimensions
within the bioreactor. b Photo of the bioreactor in operation. Schematic of c translumenal flow
(axial outlet blocked), b lumenal (translumenal outlets blocked) and c combination of
translumenal and lumenal flow. Flow proceeds from the inlet on the left side, then either
through the tissue to outlet ports on the side (c, e) or axially out from the tubular tissue construct
(d, e)
fibrin-based tubular tissue constructs, in order to monitor oxygen consumption of
the tissue and provide data for DO model development. The model in this case was
expanded to include axial and transmural flow and was coupled to the DO
transport model using COMSOL. The model predicted DO profiles across the
tissue thickness as a function of the transmural flow rate as well as shear rates on
the cells within the tissue and the potential for construct bursting associated with
pressures required to impart a prescribed transmural flow.
Multiple bioreactor configurations were implemented by blocking chamber exit
ports as shown in Fig.
3
. Pure transmural (''translumenal'') flow was obtained by
blocking the axial outflow port, pure axial (''lumenal'') flow by blocking both
transmural exit ports, and simultaneous transmural and axial (''combination'') flow
were implemented by incorporating both transmural exit ports and the axial exit
port. In addition, the transmural flow rate was adjusted in this configuration by
utilizing a pressure transducer and needle valve downstream of the axial exit port.
The needle valve was adjusted to achieve a desired lumenal pressure which
corresponded to a transmural flow velocity, v
r
, given by Darcy's Law:
Search WWH ::

Custom Search