Biomedical Engineering Reference
In-Depth Information
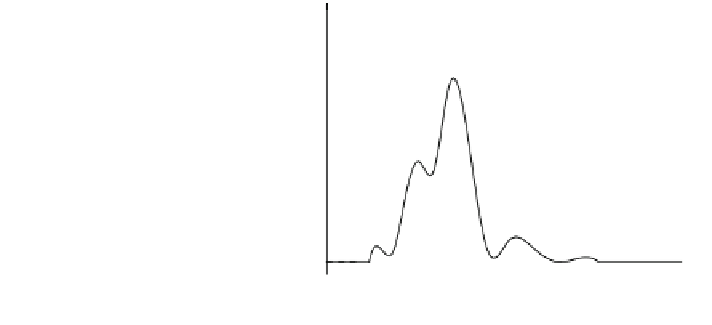
Fig. 12 Temporal evolution
of the cell number density
distribution during the
equilibration at ambient
temperature of cells
in a solution of
5000 osmol
CPA
=
m
water
glycerol solution (adapted
from [
10
])
5x10
16
Time [s]
0
1.0x10
-4
2.0x10
-4
5.0x10
-4
3.0x10
-3
4x10
16
3x10
16
2x10
16
1x10
16
0
5.0x10
-15
1.0x10
-14
0.0
1.5x10
-14
Cell volume, V [m
-3
]
from the theoretical point of view since our model does not even take into account
this mechanism of cell lethality. In addition, by keeping CPA content at low levels
cell volumic excursions during the equilibration stage are also limited, thus
avoiding this source of risk for cell damage.
Starting with the size distribution of the cell population depicted in Fig.
3
,the
dynamic evolution of the size distribution of the cell population initially at isotonic
conditions and suspended in an aqueous solution of glycerol at 5000 osmol
CPA
=
m
water
at ambient temperature is simulated as shown in Fig.
12
. As well known in the
literature, the response of the cells consists of shrinkage followed by swelling, so that
the corresponding size distribution moves back and forth (i.e. initially towards
smaller volumes, and then towards larger ones), as water and CPA move in and out
through cell membrane, until the driving forces are cancelled out when intra- and
extra-cellular concentrations of solutes become equal.
However, depending on the CPA level considered, the cell size distribution at
the end of equilibration may not coincide with the initial, isotonic one, as clearly
reported in Fig.
12
.
As a consequence, when cooling starts the size distribution of the cell population
may be quite different from the initial, isotonic one. This aspect is highlighted in
Fig.
13
a, where the temporal evolution of the average cell volume of the cell pop-
ulation with respect to the initial one is reported for the cases of glycerol addition at
different concentrations, namely 1000, 2000 and 5000 osmol
CPA
=
m
water
. This dif-
ference between initial, isotonic size distribution of the cell population and the
corresponding one at the end of the equilibration stage for different CPA concen-
tration values may be further observed from Fig.
13
b, where the temporal profile
during equilibration of the average cell volume of the size-distributed cell population
is reported at different CPA concentrations. Clearly, the equilibration time depends
on the specific values adopted for water permeability through cell membrane. The
latter one is relatively high for the rat hepatocytes considered in our simulations
(typically 30-150 s for other cell lineages), due to their peculiar ability to modulate
water permeability through aquaporins, necessary for carrying out their physiolog-
ical task of bile secretion.


Search WWH ::

Custom Search