Biomedical Engineering Reference
In-Depth Information
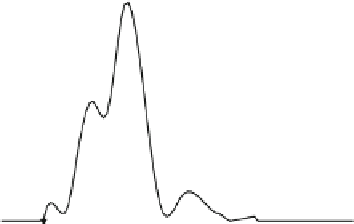
Fig. 3 Initial condition for
Eq.
15
: experimental and
interpolated cell number
density distribution as a
function of cell volume
(adapted from [
9
])
Experimental data [40]
Interpolation
4x10
16
3x10
16
2x10
16
S
mallest size
class cells
Largest size
class cells
1x10
16
0
5.0x10
-15
1.0x10
-14
1.5x10
-14
0.0
Cell volume, V [m
3
]
This hypothesis represents a clear novelty in the scientific field of cryopreservation
modelling which has been addressing a population of identically sized cells in the
last 50 years.
The first step taken towards the experimental validation of the new theory is the
direct comparison between theoretical results and measured data available in the
literature, thus tuning some adjustable parameters through a regression analysis,
i.e. fitting procedure [
9
]. Actually, this revealed to be not a straightforward
step, since the experimental data to be used have to be referred necessarily to a
population of cells. This means that, the behaviour of a relatively high number of
cells needs to be followed simultaneously under a cryomicroscope. In addition, the
corresponding size distribution of the cell population under investigation needs to
be measured and accurately reported. On the contrary, the experimental PIIF is
typically measured through cryomicroscopic analysis by observing the behaviour
of a restricted number of cells. Moreover, the size distribution is typically not
reported in the literature since the model of sporadic nucleation traditionally
adopted to interpret the system behaviour accounts only for the average cell size
considered as representative of the entire population. On the other hand, at least
the measure of the initial, isotonic size distribution of the cell population subjected
to cryopreservation is needed to validate the novel theory since it represents the
initial condition of the PBM (n
0
(V) in Eq.
15
).
Fortunately, Toner et al. [
40
] published their experimental measurements of the
PIIF of a suspension (i.e. relatively high number) of isolated rat hepatocytes
subjected to cryopreservation in absence of CPA at different cooling rates. In this
paper, the corresponding size distribution in terms of number frequency vs cell
diameter at isotonic conditions was also reported. Then, the initial, isotonic con-
dition n
0
(V) of the PBM was derived from the experimental histogram distribution
of the isolated rat hepatocytes available in the literature. It is reported in Fig.
3
in
terms of cell number density distribution as a function of cell volume. As it can be
seen, all cells fall in the range of volumes between a smallest size class and a


Search WWH ::

Custom Search