Biomedical Engineering Reference
In-Depth Information
(13)
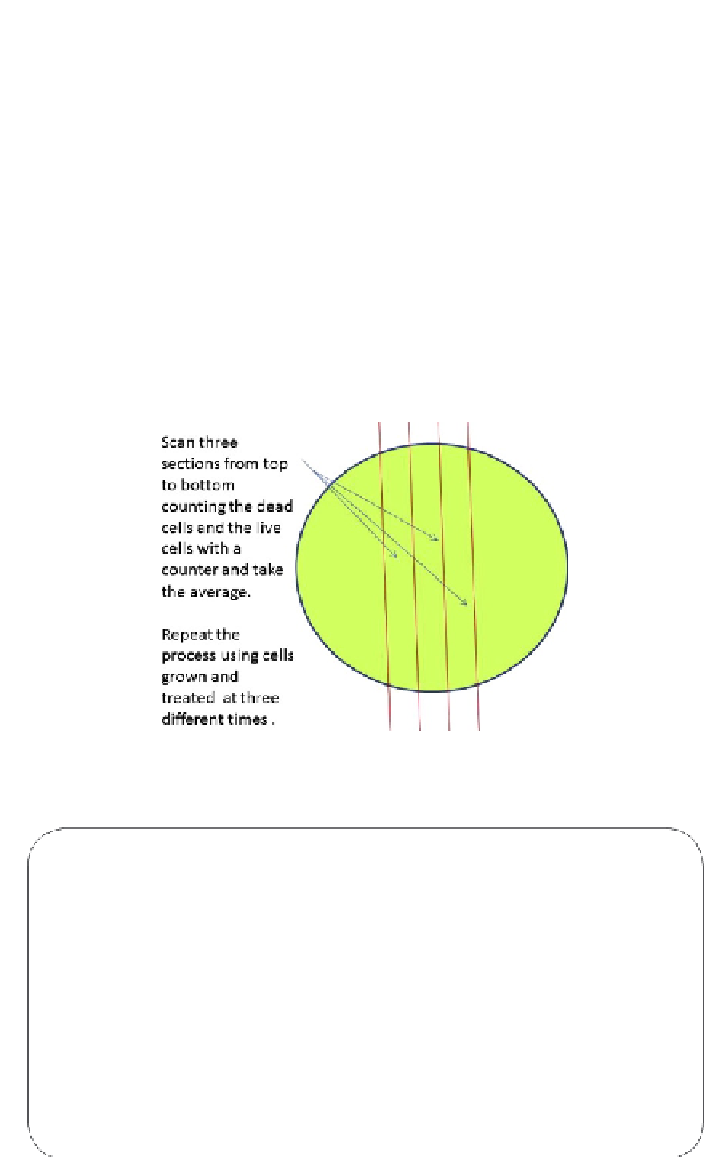
Scan each cover slip under the microscope across one edge to the other
over three sections in the middle to count the number of dead cells and the
number of live cells (see
Figure 8.4
).
(14)
Calculate the % of dead cells using:
numberofdeadcells
numberofdeadcells+numberoflivecells
% deadcells=
×100%
The results in
Table 8.3
indicated that the cadmium-free QDs, CuInS2 exhibited
minimal cell death above 0.2 µM concentration while the CdSe/ZnS exhibited
4.77% cell death even at the lowest concentration used that was at 50 nM.
131
This is almost double the cell death that was observed in the control. In order to
evaluate the effects of lower concentrations of QDs and those of different sizes,
additional studies must be performed.
FIGURE 8.4
Basis of DAPI cell death assay.
(For color version of this figure, the reader is
referred to the online version of this topic)
TABLE 8.3 % Cell Death from Exposure to QDs
QDs
Concentrations
CdSe/ZnS w/
polymer~COOH coating
0.2 µM
0.1 µM
0.05 µM
% Cell death
25.24 ± 2.32
18.16 ± 3.75
4.77 ± 1.36
CuInS2 w/polymer~COOH
coating
0.4 µM
0.2 µM
0.1 µM
% Cell death
12.01 ± 2.43
3.27 ± 0.61
1.81 ± 0.35
Control
2.89 ± 1.26