Biomedical Engineering Reference
In-Depth Information
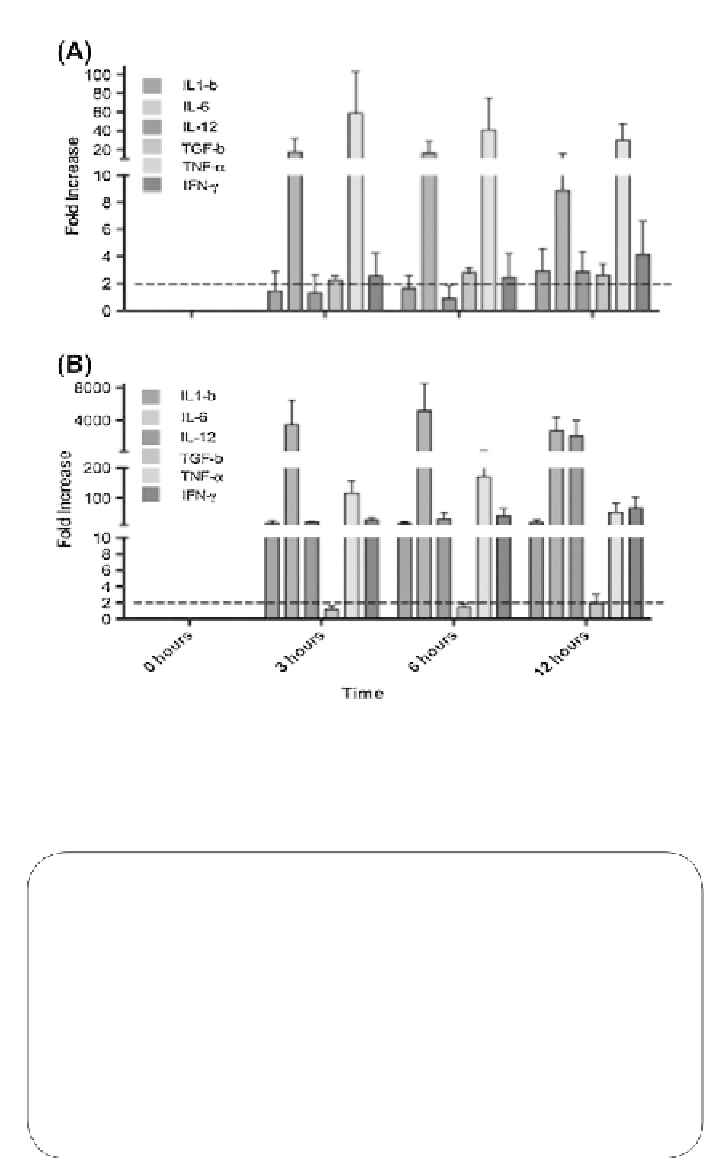
FIGURE 7.8
RT-PCR quantification of expression of six cytokine genes in QD-stimulated
dendritic cells (A) and LPS-stimulated dendritic cells (B) over a 12-h period. Data were normalized
to GAPDH and fold changes were calculated based on “0 h” samples.
From Pusic et al., 2011. (For
color version of this figure, the reader is referred to the online version of this topic)
TABLE 7.1 In vitro
P. falciparum
Growth Inhibition by Antibodies
of Mouse Immunized with Various MSP1 Formulations
Tertiary Bleed
% Growth Inhibition
rMSP1-QD (i.p.)
81
rMSP1-QD (i.m.)
73
rMSP1-QD (s.c.)
78
rMSP1-QD (s.c.)
17
rMSP1-ISA51 (i.p.)
0