Cryptography Reference
In-Depth Information
300
Y1
Y2
250
200
150
100
50
0
0
50
100
150
200
250
300
R
w
a
i
y of X
FIGURE 13.28
wise average intensity of X in
Figure 13.14
(Ramp).
300
DHSED theoretical value
DHCED theoretical value
250
200
150
100
50
0
0
50
100
150
200
250
300
R
w-
w
a
i
y of X
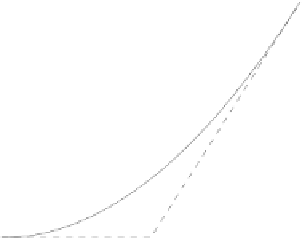
FIGURE 13.29
Theoretical average local intensity of W
b
in Y for DHSED and DHCED vs
row-wise average intensity of X in Figure 13.14 (Ramp).


Search WWH ::

Custom Search