Biomedical Engineering Reference
In-Depth Information
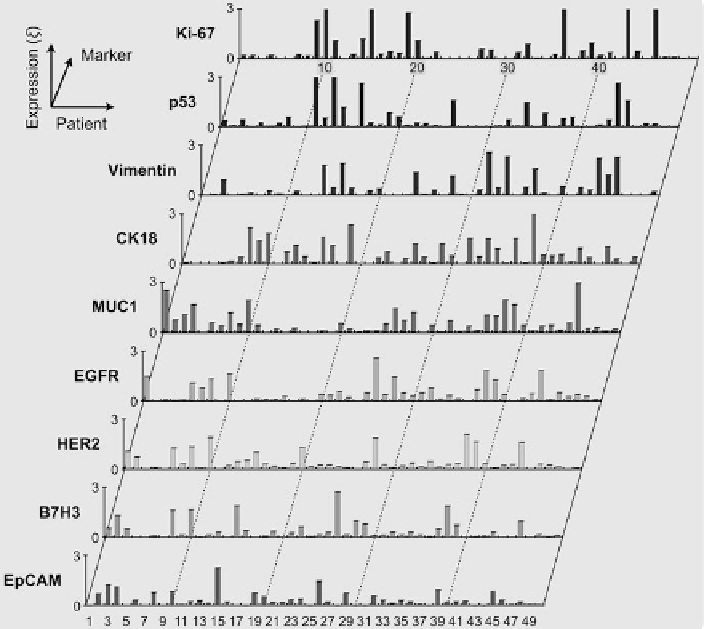
Fig. 9.11
Expression levels of different biomarkers arranged by patient number
. Note the high
degree of heterogeneity of marker expression per person. Patients 5, 12, 17, 18, 21, and 42 had
benign lesions. x-axis, patient number; y-axis, expression level () of a marker (Reproduced from
[
26
]. Copyright 2011 American Association for the Advancement of Science AAAS)
9 cancer-related markers (EpCAM, MUC-1, HER2, EGFR, B7H3, CK18, Ki-67,
p53, Vimentin), CD45 for leukocyte counts, and control (MNP-ˆ) to measure the
total cell density. A priori selection of cancer markers was based on current practice
(e.g., EpCAM, CK18) [
60
,
61
] or on reports of clinically relevant overexpression
[
62
-
64
]. On average, 3,850 cells were obtained per patient via FNA. Of these,
approximately one-third were CD45-positive leukocytes (mean: 1,273 cells), and
the remaining were nonleukocytic, primarily tumor cells as determined by flow
cytometry. The aliquots (containing
350 cells) were labeled using the BOND
method and measured by the clinical NMR system. The R
2
data with CD45
was used to account for the contribution by leukocytes; for each cancer marker,
its
cellular expression level
() was obtained based on Eq.
9.3
.
Figure
9.11
shows the profiling results of 9 cancer markers for 50 patients. When
plotted for each patient, the expression level of the markers showed considerable