Biomedical Engineering Reference
In-Depth Information
22
21
20
19
18
17
16
15
14
13
12
0
2
4
6
8
10
12
14
16
18
20
22
Ses sion
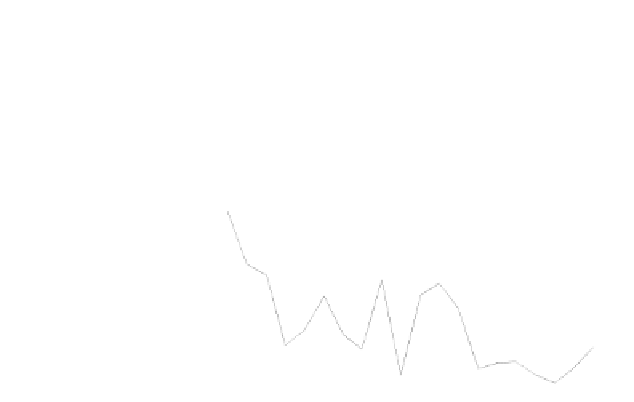
Figure 8.8
The RMSE variation across the training session for the tracking trials without
assistance or resistance from the FES-robot system.
Figure 8.8
shows the variation of the RMSE for the tracking trials. The RMSE
decreased throughout the whole training process, which implied the improved
tracking skill of the affected limbs. The decreasing trend of the RMSE ended in
the later part of the training (after session 14), which suggested a relative stable
performance achieved by the subjects.
Figure 8.9
s
hows the variation of the EMG
activation levels of the different muscles across the training sessions. Decreases
in the EMG activation levels were found in the muscles of FCR, ECR, and BIC.
The decrease of the FCR and ECR EMG levels could be related to the release of
the muscle spasticity, in accordance with the MAS wrist score. It was found the
10
7
FCR
ECR
5
4
0
0
10
10
BIC
TRI
6
6
2
2
0
5
10
15
20
0
5
10
15
20
Ses sion
Figure 8.9
The EMG activation levels for the ECR, FCR, BIC, and TRI muscles during the
training for the tracking trials without assistance or resistance from the FES-robot system.